Telecom Italia Lab
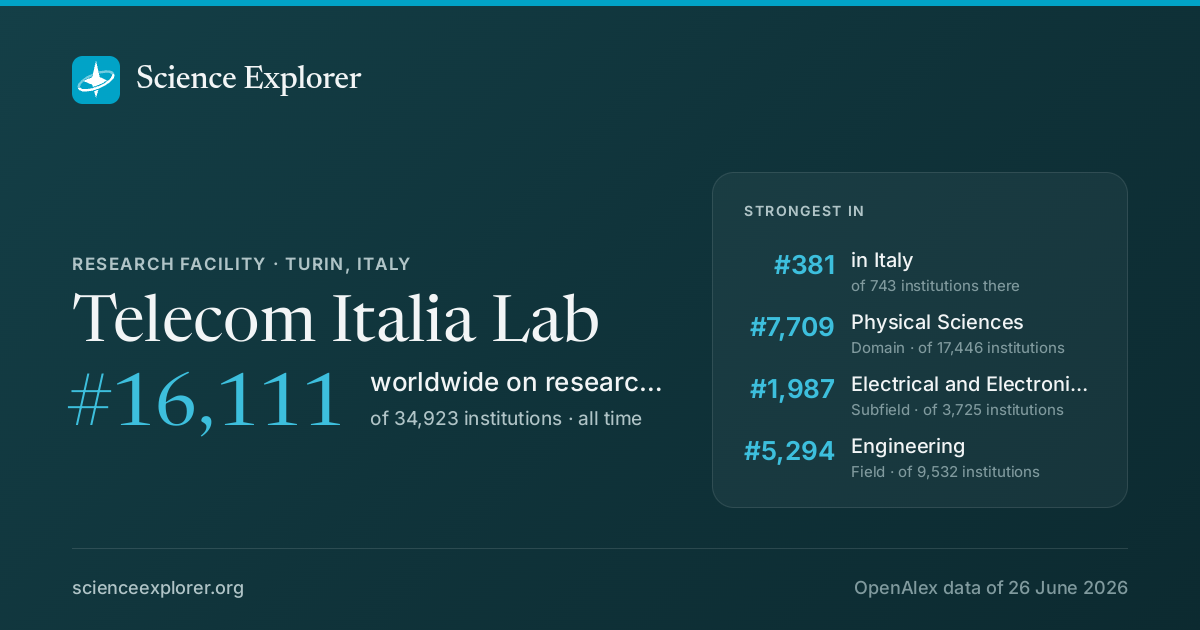
In research, Telecom Italia Lab stands highest in Physical Sciences (#7,709 of 17,446 worldwide), Electrical and Electronic Engineering (#1,987 of 3,725 worldwide) and Engineering (#5,294 of 9,532 worldwide), over all time.
- World rank, all time
- #16,111 of 34,923
- Rank in Italy
- #381 of 743
- Research works
- 1.2k ▲ 60% vs 2018-21
- Citations
- 11k 9.2 per fractional work
- Top-10% rate
- 12.8% all institutions 10.0%
- vs its own fields
- 0.86× 1.00× is exactly expected
- Open access
- 5% world 40%
- International
- 9% world 18%
What is Telecom Italia Lab known for in research?
The fields where it stands highest, over all time, ranked among every institution above the floor in each field.
| Field | World rank | Where that sits | Top-10% rate | Works |
|---|---|---|---|---|
| Physical SciencesDomain | #7,709 of 17,446 | 3.6% | 1,138 | |
| Electrical and Electronic EngineeringSubfield | #1,987 of 3,725 | 3.9% | 482 | |
| EngineeringField | #5,294 of 9,532 | 3.9% | 620 | |
| Computer ScienceField | #3,788 of 6,336 | 3.5% | 368 | |
| Computer Networks and CommunicationsSubfield | #1,448 of 1,775 | 4.2% | 129 |
Each strip is that field's whole ranked pool, with the notch where Telecom Italia Lab sits in it, in the colour of the band that rank falls in. The track under the rate is the rate itself: it carries no average mark, because the average differs by field (from about 6% in Dentistry to 21% in Economics).
Which fields of science does Telecom Italia Lab work in?
In all years, 94% of research at Telecom Italia Lab is in Physical Sciences, 4% in Social Sciences. Its largest fields are Engineering (51%), Computer Science (30%), Physics and Astronomy (8%). It does 2.3× the world's share of Physical Sciences.
Each ring splits the one inside it: the four domains of science, their fields, their subfields. Size is fractional works in all years. Every slice is a page; the interactive view zooms down to single topics and colours each by how much more of it this institution does than the world.
Its 4 domains and 24 fields, with their numbers
- Physical Sciences1,13894.3%
- Engineering62051.4%
- Computer Science36830.5%
- Physics and Astronomy937.7%
- Materials Science383.2%
- Chemistry80.7%
- Earth and Planetary Sciences60.5%
- Environmental Science20.2%
- Mathematics20.1%
- Chemical Engineering10.1%
- Energy00.0%
- Social Sciences514.2%
- Life Sciences121.0%
- Health Sciences60.5%
- Medicine50.4%
- Health Professions10.1%
- Nursing00.0%
Field profile
Location quotient across every field it publishes in: outside the ring is more than an institution of this size would be expected to publish, inside it is less.
Rings at 0.5×, 1× and 2×. Widest outward: Arts and Humanities, 6.8×. Every wedge is a field page.
All 16 fields, with their numbers
- Arts and Humanities6.85×2 works
- Pharmacology, Toxicology and Pharmaceutics4.61×0 works
- Nursing3.32×0 works
- Neuroscience3.00×0 works
- Engineering1.64×2 works
- Earth and Planetary Sciences1.41×0 works
- Agricultural and Biological Sciences1.20×1 works
- Chemistry1.04×0 works
- Medicine0.97×2 works
- Materials Science0.93×0 works
- Psychology0.80×0 works
- Computer Science0.77×1 works
- Environmental Science0.65×0 works
- Health Professions0.62×0 works
- Physics and Astronomy0.49×0 works
- Biochemistry, Genetics and Molecular Biology0.30×0 works
- Arts and Humanities 6.8×
- Pharmacology, Toxicology and Pharmaceutics 4.6×
- Nursing 3.3×
- Neuroscience 3.0×
- Engineering 1.6×
- Earth and Planetary Sciences 1.4×
- Agricultural and Biological Sciences 1.2×
- Chemistry 1.0×
- Medicine 1.0×
- Materials Science 0.9×
- Psychology 0.8×
- Computer Science 0.8×
- Environmental Science 0.7×
- Health Professions 0.6×
- Physics and Astronomy 0.5×
- Biochemistry, Genetics and Molecular Biology 0.3×
Who are the top researchers at Telecom Italia Lab?
Ranked on the quality score, S. Mosso, Matteo D’Ambrosio and F. Cisternino lead among researchers whose main affiliation is Telecom Italia Lab.
- 1
S. Mosso
 Italy · #2,596,250 worldwide
609 citations · 36 works
- 2
Matteo D’Ambrosio
Italy · #3,086,652 worldwide
446 citations · 27 works
- 3
F. Cisternino
Italy · #3,208,058 worldwide
407 citations · 48 works
- 4
Tiziana Tambosso
Italy · #3,460,945 worldwide
681 citations · 32 works
- 5
Emilio Vezzoni
Italy · #3,497,046 worldwide
745 citations · 31 works
- 6
Bruno Melis
Italy · #3,693,310 worldwide
382 citations · 28 works
- 7
Alberto Ciaramella
Italy · #4,344,710 worldwide
257 citations · 22 works
- 8
B. Costa
Italy · #4,392,901 worldwide
418 citations · 34 works
- 9
P. Cinato
Italy · #4,396,565 worldwide
198 citations · 15 works
- 10
Piero Gambini
Italy · #4,421,495 worldwide
1.2k citations · 45 works
Which keywords describe research at Telecom Italia Lab?
By fractional works in all years, weighted toward what it does more of than the world: Optical Fiber, Integrated Circuits, Semiconductor Lasers, Optical Interconnects, Vertical-Cavity Surface-Emitting Lasers (VCSELs), Wireless Networks, Biosensors and Optical Modulators.
- Nonlinear Optics
- JPEG2000
- Single-Photon Source
- Convolutional Neural Networks
- Band Parameters
- Hyperspectral Imaging
- Semiconductor
- Wireless Communications
- Fault Tolerance
- Microwave Photonics
- CDMA Systems
- Power Control
- Coherent Detection
- Resource Allocation
- Microcavities
- Raman Lasers
- Biosensors
- Vertical-Cavity Surface-Emitting Lasers (VCSELs)
- Semiconductor Lasers
- Deep Learning
- Optical Fiber
- Integrated Circuits
- Optical Interconnects
- Wireless Networks
- Optical Modulators
- Silicon Photonics
- Nanophotonic Waveguides
- Digital Signal Processing
- Nonlinear Effects
- Channel Assignment
- Multiuser Detection
- Energy Efficiency
- Video Coding
- Photovoltaics
- Nanowires
- Distributed Systems
- Quantum Dots
- Excitons
- Fiber Lasers
- Wavelet Compression
Size is fractional works in all years in the topics tagged with each word; colour is the word's share of this institution's work against its share of the world's. The 40 words are chosen for being large and distinctive. Each links to the topic it comes from most.
All 40 words, with their numbers
- Optical Fiber90▲ 57×3 topics
- Deep Learning80▲ 3.1×30 topics
- Integrated Circuits77▲ 27×3 topics
- Semiconductor Lasers76▲ 66×2 topics
- Optical Interconnects75▲ 78×1 topic
- Vertical-Cavity Surface-Emitting Lasers (VCSELs)75▲ 78×1 topic
- Wireless Networks69▲ 25×8 topics
- Biosensors66▲ 9.5×5 topics
- Optical Modulators64▲ 26×3 topics
- Raman Lasers64▲ 31×2 topics
- Silicon Photonics62▲ 33×2 topics
- Microcavities62▲ 33×1 topic
- Nanophotonic Waveguides62▲ 36×1 topic
- Resource Allocation61▲ 22×6 topics
- Digital Signal Processing61▲ 70×2 topics
- Coherent Detection60▲ 82×1 topic
- Nonlinear Effects60▲ 82×1 topic
- Power Control58▲ 43×3 topics
- Channel Assignment51▲ 39×3 topics
- CDMA Systems47▲ 82×1 topic
- Multiuser Detection47▲ 82×1 topic
- Microwave Photonics41▲ 29×2 topics
- Energy Efficiency40▲ 4.2×13 topics
- Fault Tolerance40▲ 16×5 topics
- Video Coding39▲ 70×2 topics
- Wireless Communications39▲ 21×3 topics
- Photovoltaics38▲ 13×4 topics
- Semiconductor37▲ 9.4×3 topics
- Nanowires36▲ 13×4 topics
- Hyperspectral Imaging36▲ 9.3×3 topics
- Distributed Systems36▲ 12×6 topics
- Band Parameters35▲ 24×2 topics
- Quantum Dots35▲ 19×2 topics
- Convolutional Neural Networks34▲ 6.7×9 topics
- Excitons34▲ 35×1 topic
- Single-Photon Source34▲ 35×1 topic
- Fiber Lasers32▲ 19×3 topics
- JPEG200029▲ 83×1 topic
- Wavelet Compression29▲ 83×1 topic
- Nonlinear Optics29▲ 14×4 topics
Which research topics does Telecom Italia Lab publish most on?
By volume in 2022-now: Theatre and Performance Studies, Architecture, Design, and Social History, Advanced MIMO Systems Optimization and Energy Harvesting in Wireless Networks.
Area is fractional works; colour is the subfield each topic belongs to.
- 1 Theatre and Performance Studies Visual Arts and Performing Arts 1 works
- 2 Architecture, Design, and Social History Conservation 0 works
- 3 Advanced MIMO Systems Optimization Electrical and Electronic Engineering 0 works
- 4 Energy Harvesting in Wireless Networks Electrical and Electronic Engineering 0 works
- 5 Software-Defined Networks and 5G Computer Networks and Communications 0 works
- 6 Design Education and Practice Mechanical Engineering 0 works
- 7 Medical Imaging Techniques and Applications Radiology, Nuclear Medicine and Imaging 0 works
- 8 Radiopharmaceutical Chemistry and Applications Radiology, Nuclear Medicine and Imaging 0 works
- 9 3D Surveying and Cultural Heritage Geology 0 works
- 10 Psychosomatic Disorders and Their Treatments Psychiatry and Mental health 0 works
How open and international is its research?
Against the world's own shares: the tick on each track. Both are shares of its output, so they sit on one scale and can be read against each other as well as against the world.
World: 40% of research is openly available.
World: 18% is written across borders.
How has Telecom Italia Lab's research output changed?
Output in 2022-2025 was 60% higher than in 2018-2021.
The same series as a ribbon: one cell per year, darker for more. The line above answers how much; this answers when.
Its share of all research
Growing output can still be a shrinking share: all of science grows. This is Telecom Italia Lab as a percentage of every work published that year, 0.000021% in 2024.
Fractional works of Telecom Italia Lab over all fractional works that year. How the balance of science has shifted.
How much of it reaches the world top 10%
Year by year, against all institutions in the same year.
Of each year's output, the share that reached the world's 10% most cited for its field and year. Peak 9.4% in 2000.
Other research institutions in Turin
- University of Turin
- Politecnico di Torino
- Istituto Nazionale di Ricerca Metrologica
- Tecnologie Avanzate (Italy)
- Ospedale Regina Margherita
- Torino e-district
- Fondazione Ricerca Molinette
- A. O. Ordine Mauriziano di Torino

Share Telecom Italia Lab's ranking
Badges for a website1Each links back here and updates with every snapshot

Research measures only: rankings here say nothing about teaching, admissions or student experience. Comparable institutions and collaboration partners have tabs of their own, above.
Discussion
Ask a question or share a note about Telecom Italia Lab. Posts are plain text and can be reported.