Software research
Software is a subfield of Computer Science. Science Explorer counts 99k research works in it since 1950. 9.9% of them reached the world's top 10% most cited for their field and year.
In short: non-tangible executable component of a computer.
- Research works
- 99k fractional, since 1950
- In the world top 10%
- 9.8k per year above
- Top-10% rate
- 9.9% share of its works in the world top 10%
- Topics
- 5
- Growth, 2018-21 → 2022-25
- -1% the tick is no change
- Largest producer
 China
28% of the 10 largest, 2022-now
What is Software research about, and what is growing?
By the world's output in 2021-25, its most used keywords are Automated Testing, Software Fault Localization, Architecture-Based Approach, Software Reliability Modeling, Software Development, Domain-Specific Languages. Gaining share since 2011-15: Automated Testing, Software Fault Localization. Losing share: Domain-Specific Languages, Model-Driven Engineering, Software Development.
- End-User Software Engineering
- Information Systems
- Domain-Specific Languages
- Software Reliability Modeling
- Software Fault Localization
- Automated Testing
- Architecture-Based Approach
- Software Development
- Model-Driven Engineering
- Modeling
- Meta-design
Size is the world's fractional works in 2021-25 in the topics tagged with each word; colour compares the word's share of this field with 2011-15. Each links to the topic it comes from most.
All 11 words, with their numbers
- Automated Testing6,952▲ 1.24×1 topic
- Software Fault Localization6,952▲ 1.24×1 topic
- Architecture-Based Approach6,361◆ 1.00×1 topic
- Software Reliability Modeling6,361◆ 1.00×1 topic
- Software Development3,516▼ 0.71×2 topics
- Domain-Specific Languages2,625▼ 0.64×1 topic
- Model-Driven Engineering2,625▼ 0.64×1 topic
- Information Systems891◆ 1.04×1 topic
- Modeling891◆ 1.04×1 topic
- End-User Software Engineering688◆ 1.10×1 topic
- Meta-design688◆ 1.10×1 topic
Which countries lead Software research?
On research quality in 2022-now, the United States, China and Germany rank highest in Software. By volume, China and the United States publish the most (2.9k and 2.4k works in 2022-now).
By research quality, 2022-now
- 1
 United States #1 all time
1.05× citation excellence · 1.53× journals · 100% breadth
10.9% top 10% · 2.1k works
- 2
China #3 all time
1.09× citation excellence · 1.03× journals · 100% breadth
12.5% top 10% · 2.7k works
- 3
 Germany #2 all time
0.91× citation excellence · 1.39× journals · 100% breadth
8.8% top 10% · 995 works
- 4
 United Kingdom #4 all time
1.08× citation excellence · 1.44× journals · 100% breadth
11.3% top 10% · 491 works
- 5
 Canada #5 all time
1.38× citation excellence · 1.20× journals · 100% breadth
14.2% top 10% · 400 works
- 6
 Netherlands #10 all time
1.19× citation excellence · 1.45× journals · 100% breadth
9.8% top 10% · 217 works
- 7
 Spain #6 all time
1.24× citation excellence · 0.99× journals · 100% breadth
11.8% top 10% · 274 works
- 8
 Italy #13 all time
1.22× citation excellence · 0.67× journals · 100% breadth
12.6% top 10% · 406 works
- 9
 India #17 all time
0.80× citation excellence · 0.45× journals · 100% breadth
5.6% top 10% · 1.1k works
- 10
 France #9 all time
0.55× citation excellence · 1.25× journals · 100% breadth
5.4% top 10% · 363 works
The track on each row is that row's top-10% rate. The ranking itself is the quality score, which compares the rate with what each place's own topics predict, adds its share of papers in the Nature Index journals, and counts output and breadth too.
Of 12 countries ranked in Software. Ranked on the quality score for 2022-now; the bracket is the all-time rank.
All countries ranked in SoftwareBy volume, 2022-now
- 1
China
2.9k works
- 2
United States
2.4k works
- 3
India
1.2k works
- 4
Germany
1.1k works
- 5
United Kingdom
546 works
- 6
Italy
443 works
- 7
Canada
436 works
- 8
France
396 works
- 9
 Japan
377 works
- 10
 Brazil
342 works
How concentrated that is
The same countries as shares of everything the list above accounts for. A node where two countries do two thirds of the work and one spread evenly across twelve read alike as a ranking and not at all alike here.
Shares of the rows listed above, not of the whole node.
Which institutions lead Software research?
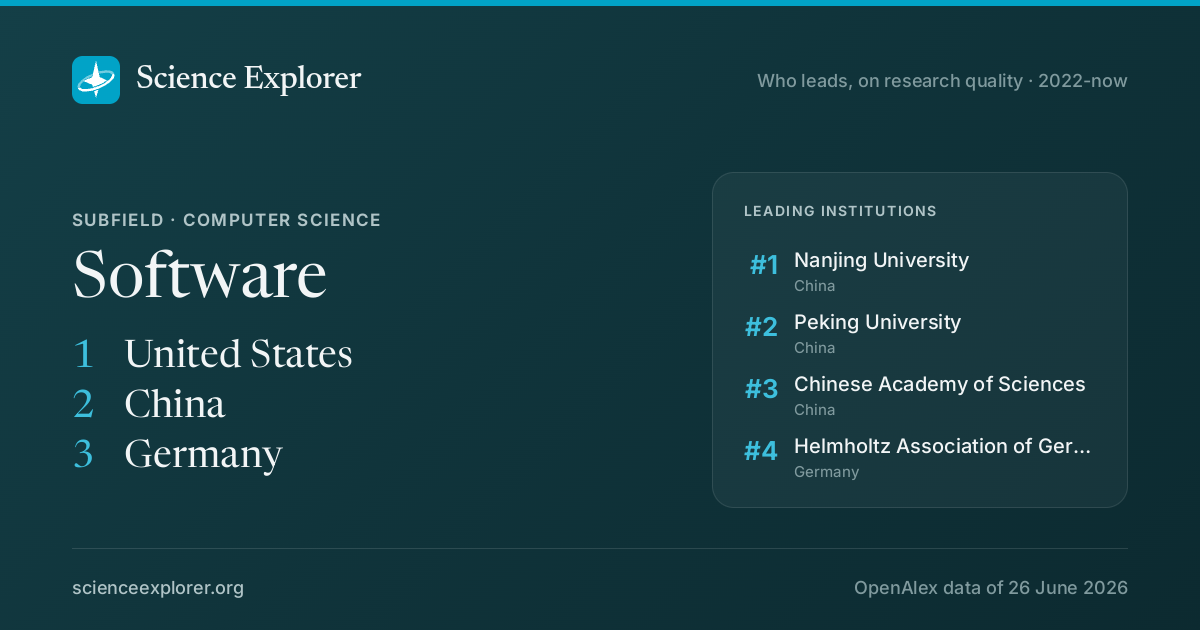
Nanjing University (China) ranks first in Software on research quality in 2022-now, followed by Peking University and Chinese Academy of Sciences.
By research quality, 2022-now
- 1
Nanjing University China · Nanjing · #6 all time
17.2% top 10% · 96 works
- 2
Peking University China · Beijing · #10 all time
21.2% top 10% · 62 works
- 3
Chinese Academy of Sciences China · Beijing · #19 all time
11.0% top 10% · 130 works
- 4
Helmholtz Association of German Research Centres Germany · Berlin · #24 all time
7.7% top 10% · 83 works
- 5
Beihang University China · Beijing · #46 all time
15.2% top 10% · 103 works
- 6
Centre National de la Recherche Scientifique France · Paris · #18 all time
5.5% top 10% · 98 works
- 7
National University of Defense Technology China · Changsha
8.2% top 10% · 92 works


The track on each row is that row's top-10% rate. The ranking itself is the quality score, which compares the rate with what each place's own topics predict, adds its share of papers in the Nature Index journals, and counts output and breadth too.
Of 7 institutions above the floor of 40 fractional works in Software.
Top 100 Software institutionsBy volume, 2022-now
- 1
Chinese Academy of SciencesChina
140 works
- 2
Beihang UniversityChina
109 works
- 3
Centre National de la Recherche ScientifiqueFrance
107 works
- 4
Nanjing UniversityChina
102 works
- 5
National University of Defense TechnologyChina
99 works
- 6
Helmholtz Association of German Research CentresGermany
91 works
- 7
Peking UniversityChina
66 works
- 8
Nanjing University of Aeronautics and AstronauticsChina
59 works
- 9
Carnegie Mellon UniversityUnited States
59 works
- 10
Technical University of MunichGermany
55 works
Who are the leading researchers in Software?
Counting only their work in Software, Mark Harman, Lionel Briand and David Lo have the most papers in the world top 10% for their subfield and year beyond the 10% expected.
- 1
Mark Harman
United Kingdom · #10,640 worldwide overall
68.2 of 180 papers here in the top 10%
- 2
Lionel Briand
 Luxembourg · #12,133 worldwide overall
57.5 of 139 papers here in the top 10%
- 3
David Lo
 Singapore · #10,678 worldwide overall
65.7 of 128 papers here in the top 10%
- 4
Xin Xia
Singapore · #3,448 worldwide overall
34.9 of 62 papers here in the top 10%
- 5
Gregg Rothermel
United States · #23,338 worldwide overall
39.3 of 88 papers here in the top 10%
- 6
Mary Jean Harrold
United States · #11,748 worldwide overall
35.8 of 78 papers here in the top 10%
- 7
Lingming Zhang
United States · #5,496 worldwide overall
31.7 of 48 papers here in the top 10%
- 8
Andrea Arcuri
 Norway · #9,146 worldwide overall
33.9 of 68 papers here in the top 10%
- 9
Tao Xie
United States · #57,216 worldwide overall
41.0 of 116 papers here in the top 10%
- 10
Michael D. Ernst
United States · #19,816 worldwide overall
30.8 of 61 papers here in the top 10%
Ranked on their work in Software alone: how many more of their papers here reached the world top 10% for their subfield and year than the 10% expected, among 190,910 ranked researchers with a paper here. Each paper counts once, so many strong papers outrank one famous one, and a long record of ordinary papers does not climb. Identities come from OpenAlex author disambiguation, which occasionally merges or splits people.
Top 100 Software researchersWhere is Software research done?
The largest centres of Software research in 2022-now are Beijing (China), Nanjing (China), Shanghai (China) and London (United Kingdom). Among places with at least 20 works in it, it is an unusually large share of all research in Västerås, Sharon and Lugano.
Largest cities, 2022-now
Where it is the local speciality
- VästeråsSE · 32.6 works46×
- SharonUS · 51.1 works32×
- LuganoCH · 32.3 works21×
- PassauDE · 23.1 works21×
Location quotient: how much more of its research is in Software than the world average.
Software research by country
The best places for Software research inside each country, with that country's researchers and world standing.
Where is the best place to study Software?
Among universities, judged by research, Nanjing University, ETH Zurich and Peking University score highest, combining standing in the field's ranking, citation excellence, specialisation, size, growth and international reach. Research strength is one signal when choosing where to study; it does not measure teaching.
One dot per university in the first ten of the table below, at the default weights. The upper left is the interesting corner: small places doing unusually strong work.


























Universities only. The score blends standing (50%), citation excellence (20%), size (15%), specialisation (5%), growth (5%), international reach (5%), 2022-now; growth compares 2018-21 with 2022-25 and counts up to +20%, since a jump from a small base is mostly noise. Standing is the score in this field's institution ranking, three quarters over all time and a quarter 2022-now; excellence averages the two windows too. Four years alone undercount fields such as AI, where many conference and arXiv papers from 2022 on carry no affiliation in the data.
Every institution in Software, country by countryIs Software research growing?
Output in 2022-2025 was 1% lower than in 2018-2021, peaking in 2014. The fastest-growing topics are Spreadsheets and End-User Computing and Software Testing and Debugging Techniques.
The same series as a ribbon: one cell per year, darker for more. The line above answers how much; this answers when.
Its share of all research
Growing output can still be a shrinking share: all of science grows. This is Software as a percentage of every work published that year, 0.067% in 2024.
Fractional works of Software over all fractional works that year. How the balance of science has shifted.
How much of it reaches the world top 10%
Year by year.
Of each year's works in it, the share that reached the world's 10% most cited for their field and year. A field is the world for its own topics, so there is no other line to hold it against.
Which topics inside it are moving
Growth and decline on one axis around a shared zero. Two lists side by side hide the thing that matters: whether the growth dwarfs the decline, or the other way round.
- Spreadsheets and End-User Computing+15%
- Software Testing and Debugging Techniques+9%
- Model-Driven Software Engineering Techniques-5%
- Software Reliability and Analysis Research-6%
- Engineering and Information Technology-18%
Growth in output from 2018-21 to 2022-25. Every topic is a page of its own.
What does Software include?
Area is fractional works in that topic. Every name below is a page of its own.
Share who leads Software
The leading institutions' badges6Each links to that institution's page and updates with every snapshot


Questions people ask
Who leads software engineering research?
Nanjing University (China) ranks first in Software on research quality in 2022-now, followed by Peking University and Chinese Academy of Sciences. On research quality in 2022-now, the United States, China and Germany rank highest in Software. By volume, China and the United States publish the most (2.9k and 2.4k works in 2022-now).
Discussion
Ask a question or share a note about Software. Keep it to the research: no personal attacks, advertising or links. Any reader can report a post, which collapses it for everyone until it is opened.