 Science in Australia
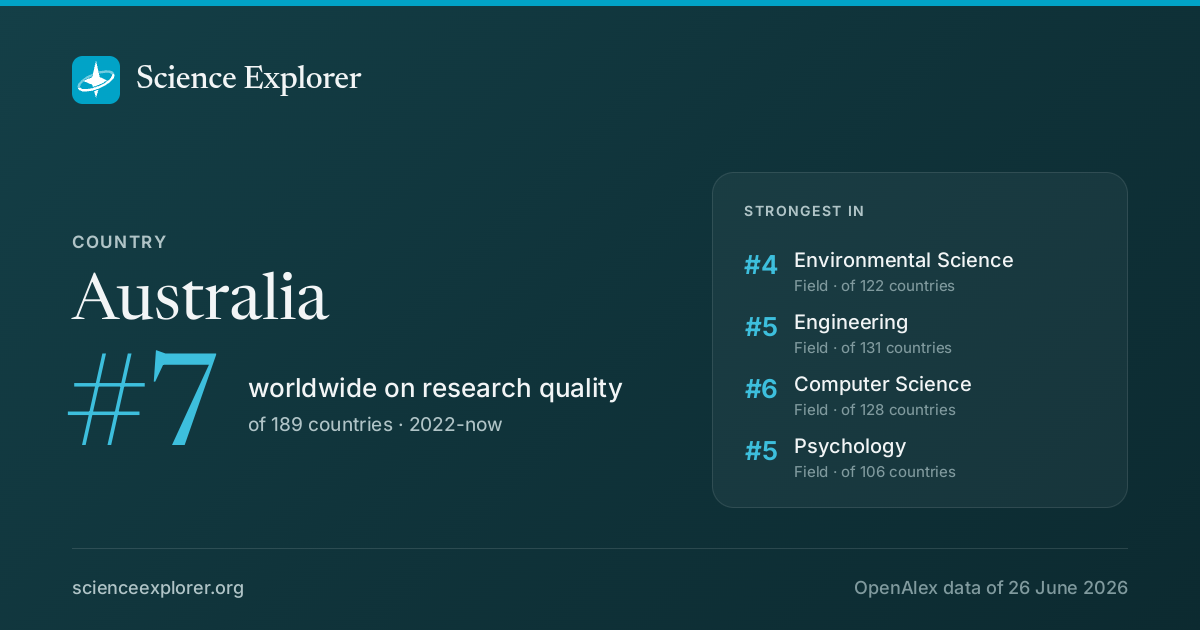
Australia ranks #7 of 189 countries on research quality in 2022-now (#8 all time), with 343k research works and 15.0% of them in the world's top 10%.
- World rank, 2022-now
- #7 of 189 · #8 all time
- Works, 2022-now
- 343k ▼ 3% vs 2018-21
- Citations
- 62.3M 28.5 per fractional work, all time
- Top-10% rate
- 15.0% all institutions 10.0%
- vs its own fields
- 1.29× 1.00× is exactly expected
- In the world top 100
- 5 35 in the top 1,000
- Open access
- 40% world 40%
- International
- 26% world 18%
AustraliaWhat is Australia strongest at in science?
On research quality in 2022-now, Australia ranks highest in Environmental Science (#4 of 122), Engineering (#5 of 131) and Computer Science (#6 of 128). Relative to its size it is most specialised in Research and Theory, Public Administration and Medical Terminology.
| Field | World rank | Where that sits | Top-10% rate | Works | All time | Institutions |
|---|---|---|---|---|---|---|
| Environmental ScienceField | #4 of 122 | 14.3% | 21,127 | #3 | Institutions | |
| EngineeringField | #5 of 131 | 16.2% | 36,570 | #5 | Institutions | |
| Computer ScienceField | #6 of 128 | 16.7% | 20,348 | - | Institutions | |
| PsychologyField | #5 of 106 | 16.5% | 18,329 | #7 | Institutions | |
| Health ProfessionsField | #5 of 106 | 15.4% | 16,455 | #5 | Institutions | |
| Social SciencesField | #7 of 148 | 16.0% | 47,442 | #7 | Institutions | |
| Agricultural and Biological SciencesField | #6 of 124 | 15.4% | 12,283 | #6 | Institutions | |
| Sociology and Political ScienceSubfield | #6 of 119 | 15.8% | 15,676 | #7 | Institutions | |
| Health, Toxicology and MutagenesisSubfield | #3 of 56 | 13.1% | 2,147 | - | Institutions | |
| EducationSubfield | #6 of 112 | 19.0% | 7,788 | #4 | Institutions | |
| Building and ConstructionSubfield | #4 of 71 | 18.6% | 2,567 | #4 | Institutions | |
| Civil and Structural EngineeringSubfield | #4 of 71 | 17.2% | 3,786 | #4 | Institutions |
Where its research is concentrated
Location quotient: how much more (or less) of each node it does than its size predicts. Drawn around 1×, where "twice the world share" and "half of it" are the same distance apart in opposite directions. A volume reading, which on a country axis is largely population and industrial structure.
- Research and TheorySubfield · 417.5 works · #4 of 183 active here4.2×
- Public AdministrationSubfield · 681.4 works · #3 of 186 active here3.2×
- Medical TerminologySubfield · 33.6 works · #7 of 121 active here2.9×
- HealthSubfield · 2,926.2 works · #6 of 217 active here2.5×
- Emergency Medical ServicesSubfield · 1,705.2 works · #5 of 215 active here2.4×
- Applied PsychologySubfield · 1,297.2 works · #6 of 199 active here2.3×
- EquineSubfield · 115.1 works · #6 of 135 active here2.3×
- Ecological ModelingSubfield · 674.4 works · #5 of 210 active here2.3×
The whole field profile
All 26 fields at once. A specialist and a generalist produce the same ranked list and a completely different shape.
Rings at 0.5×, 1× and 2×. Widest outward: Health Professions, 1.8×. Every wedge is a field page.
All 26 fields, with their numbers
- Health Professions1.79×18k works
- Psychology1.76×21k works
- Veterinary1.61×852 works
- Neuroscience1.29×8,133 works
- Environmental Science1.24×24k works
- Medicine1.22×91k works
- Earth and Planetary Sciences1.18×7,237 works
- Nursing1.16×2,206 works
- Decision Sciences1.15×4,342 works
- Social Sciences1.09×54k works
- Immunology and Microbiology1.07×4,182 works
- Economics, Econometrics and Finance1.07×8,913 works
- Arts and Humanities0.98×11k works
- Biochemistry, Genetics and Molecular Biology0.89×19k works
- Business, Management and Accounting0.89×11k works
- Energy0.86×3,079 works
- Computer Science0.77×23k works
- Physics and Astronomy0.76×6,600 works
- Agricultural and Biological Sciences0.75×14k works
- Pharmacology, Toxicology and Pharmaceutics0.70×958 works
- Engineering0.70×41k works
- Dentistry0.69×1,311 works
- Chemical Engineering0.67×910 works
- Mathematics0.62×2,858 works
- Materials Science0.56×7,682 works
- Chemistry0.52×3,176 works
Which fields of science does Australia work in?
In 2022-now, 31% of research in Australia is in Physical Sciences, 29% in Health Sciences. Its largest fields are Medicine (23%), Social Sciences (14%), Engineering (10%). It does 1.3× the world's share of Health Sciences.
Each ring splits the one inside it: the four domains of science, their fields, their subfields. Size is fractional works in 2022-now. Every slice is a page; the interactive view zooms down to single topics and colours each by how much more of it this country does than the world.
Its 4 domains and 26 fields, with their numbers
- Physical Sciences120k30.7%
- Engineering41k10.5%
- Environmental Science24k6.2%
- Computer Science23k6.0%
- Materials Science7,6822.0%
- Earth and Planetary Sciences7,2371.9%
- Physics and Astronomy6,6001.7%
- Chemistry3,1770.8%
- Energy3,0790.8%
- Mathematics2,8580.7%
- Chemical Engineering9100.2%
- Health Sciences114k29.3%
- Medicine91k23.4%
- Health Professions18k4.7%
- Nursing2,2060.6%
- Dentistry1,3110.3%
- Veterinary8520.2%
- Social Sciences110k28.3%
- Social Sciences54k13.8%
- Psychology21k5.4%
- Business, Management and Accounting11k2.9%
- Arts and Humanities11k2.8%
- Economics, Econometrics and Finance8,9132.3%
- Decision Sciences4,3421.1%
- Life Sciences46k11.8%
Which keywords describe research in Australia?
By fractional works in 2022-now, weighted toward what it does more of than the world: Epidemiology, Climate Change, Mental Health, Public Health, Quality of Life, Globalization, Machine Learning and Sustainability.
- Decolonization
- Population Dynamics
- Health Equity
- Adolescents
- Primary Care
- Physical Activity
- Anxiety
- Prevalence
- Social Support
- Biodiversity
- Metabolic Syndrome
- Social Media
- Oxidative Stress
- Depression
- Environmental Impact
- Quality of Life
- Public Health
- Sustainability
- Deep Learning
- Climate Change
- Epidemiology
- Machine Learning
- Mental Health
- Globalization
- Inflammation
- Risk Factors
- Cardiovascular Disease
- Treatment
- Healthcare
- Resilience
- Genetics
- Identity
- Mortality
- Global Burden
- Aging
- Ethics
- Ethical Considerations
- Neoliberalism
- Vulnerability
- Health Disparities
Size is fractional works in 2022-now in the topics tagged with each word; colour is the word's share of this country's work against its share of the world's. The 40 words are chosen for being large and distinctive. Each links to the topic it comes from most.
All 40 words, with their numbers
- Epidemiology21k▲ 1.37×140 topics
- Climate Change15k▲ 1.45×132 topics
- Machine Learning11k▼ 0.86×97 topics
- Deep Learning11k▼ 0.79×85 topics
- Mental Health9,669▲ 1.74×48 topics
- Sustainability9,393◆ 0.99×140 topics
- Globalization9,017▲ 1.18×185 topics
- Public Health8,739▲ 1.54×77 topics
- Inflammation8,511◆ 1.03×83 topics
- Quality of Life8,357▲ 1.49×61 topics
- Risk Factors6,421▲ 1.50×37 topics
- Environmental Impact6,048◆ 0.91×74 topics
- Cardiovascular Disease5,888▲ 1.33×39 topics
- Depression5,660▲ 1.65×26 topics
- Treatment5,636▲ 1.19×52 topics
- Oxidative Stress5,147▼ 0.80×63 topics
- Healthcare5,064◆ 1.14×44 topics
- Social Media4,900◆ 0.91×41 topics
- Resilience4,114▲ 2.1×19 topics
- Metabolic Syndrome4,006▲ 1.27×24 topics
- Genetics3,863▲ 1.40×27 topics
- Biodiversity3,847▲ 1.30×38 topics
- Identity3,769▲ 1.34×79 topics
- Social Support3,667▲ 1.75×20 topics
- Mortality3,644▲ 1.65×13 topics
- Prevalence3,622▲ 2.3×15 topics
- Global Burden3,532▲ 1.66×12 topics
- Anxiety3,449▲ 1.86×12 topics
- Aging3,396▲ 1.60×19 topics
- Physical Activity3,364▲ 1.78×13 topics
- Ethics3,337▲ 1.69×62 topics
- Primary Care3,139▲ 2.2×15 topics
- Ethical Considerations3,109▲ 2.3×21 topics
- Adolescents3,045▲ 2.1×11 topics
- Neoliberalism2,940▲ 2.1×30 topics
- Health Equity2,880▲ 2.5×6 topics
- Vulnerability2,625▲ 2.9×9 topics
- Population Dynamics2,566▲ 2.6×13 topics
- Health Disparities2,466▲ 2.4×9 topics
- Decolonization1,706▲ 5.4×8 topics
Which research topics does Australia publish the most in?
Its largest topics in 2022-now are Indigenous Health, Education, and Rights, Artificial Intelligence in Healthcare and Education, Australian History and Society.
Area is fractional works in 2022-now; colour is the subfield each topic belongs to. Every tile is a topic page.
- 1 Indigenous Health, Education, and Rights Health 996 works
- 2 Artificial Intelligence in Healthcare and Education Health Informatics 832 works
- 3 Australian History and Society Sociology and Political Science 810 works
- 4 Health Policy Implementation Science General Health Professions 720 works
- 5 Wildlife Ecology and Conservation Ecology 715 works
- 6 Obesity, Physical Activity, Diet Public Health, Environmental and Occupational Health 703 works
- 7 Climate Change and Health Impacts Health, Toxicology and Mutagenesis 697 works
- 8 Health Systems, Economic Evaluations, Quality of Life Economics and Econometrics 697 works
- 9 Dementia and Cognitive Impairment Research Psychiatry and Mental health 687 works
- 10 Coral and Marine Ecosystems Studies Ecology 685 works
- 11 Child and Adolescent Psychosocial and Emotional Development Clinical Psychology 681 works
- 12 COVID-19 and Mental Health Clinical Psychology 664 works
How many world-class institutions does Australia hold?
Average quality and elite capacity disagree by construction, and both are worth knowing: the first is decided by a country's whole institution population, the second counts the institutions it holds at the top. One square per institution.
| Standing among countries | 2022-now | Where that sits | All time |
|---|---|---|---|
| Average qualityits whole institution population | #7 of 189 | #8 of 203 | |
| Elite capacitythe institutions it holds at the top | #6 of 204 | #6 of 216 |
Elite capacity counts a country's institutions by their worldwide rank, weighted so a place at #1 counts for more than one at #480. Countries under 100 fractional works are left out.
Bands are exclusive, so the squares add up to 35 (the institutions it holds in the world top 1,000), not to four times it.
Which universities in Australia lead research?
The University of Melbourne, UNSW Sydney and Monash University rank highest in Australia on research quality in 2022-now.
One dot per institution in the list below. The upper left is the interesting corner.
- 1The University of MelbourneUniversity · Melbourne · #40 worldwide14.9% top 10% · 23k works
- 2UNSW SydneyUniversity · Sydney · #41 worldwide15.7% top 10% · 19k works
- 3Monash UniversityUniversity · Melbourne · #50 worldwide16.1% top 10% · 20k works
- 4The University of QueenslandUniversity · Brisbane · #69 worldwide15.0% top 10% · 20k works
- 5The University of SydneyUniversity · Sydney · #79 worldwide14.4% top 10% · 25k works
- 6Australian National UniversityUniversity · Canberra · #151 worldwide13.7% top 10% · 11k works
- 7Queensland University of TechnologyUniversity · Brisbane · #186 worldwide17.3% top 10% · 7.1k works
- 8RMIT UniversityUniversity · Melbourne · #230 worldwide17.9% top 10% · 8k works
- 9The University of AdelaideUniversity · Adelaide · #238 worldwide15.2% top 10% · 8.7k works
- 10University of Technology SydneyUniversity · Sydney · #240 worldwide18.0% top 10% · 9.2k works
- 11The University of Western AustraliaUniversity · Perth · #287 worldwide13.9% top 10% · 8.8k works
- 12La Trobe UniversityUniversity · Melbourne · #330 worldwide13.9% top 10% · 6.2k works
- 13Macquarie UniversityUniversity · Sydney · #373 worldwide15.9% top 10% · 7.6k works
- 14Commonwealth Scientific and Industrial Research OrganisationGovernment institution · Canberra · #388 worldwide14.6% top 10% · 9.9k works
- 15Deakin UniversityUniversity · Burwood · #428 worldwide17.5% top 10% · 9.3k works




The track on each row is its top-10% rate; the tick is the average of all institutions, 10.0% (how it is set): teal above it, red below.
All ranked institutions in AustraliaWho are the top researchers in Australia?
Seyedali Mirjalili, Weng Marc Lim and Shulei Chou rank highest among researchers based in Australia.
- 1 Seyedali Mirjalili #9 worldwide 154k citations · 823 works
- 2 Weng Marc Lim #78 worldwide 42k citations · 417 works
- 3 Shulei Chou #90 worldwide 63k citations · 657 works
- 4 Shi‐Zhang Qiao #130 worldwide 159k citations · 811 works
- 5 X. J. Zhu #134 worldwide 95k citations · 301 works
- 6 Mamoun Alazab #146 worldwide 30k citations · 406 works
- 7 Jade Powell #163 worldwide 85k citations · 272 works
- 8 Pingan Song #176 worldwide 34k citations · 462 works
- 9 Xiaoguang Duan #220 worldwide 63k citations · 574 works
- 10 Colm Talbot #246 worldwide 51k citations · 196 works
Which cities in Australia are research hubs?
- 1
MelbourneAustralia
463k works
- 2
SydneyAustralia
441k works
- 3
BrisbaneAustralia
261k works
- 4
CanberraAustralia
234k works
- 5
AdelaideAustralia
165k works
- 6
PerthAustralia
148k works
- 7
WollongongAustralia
42k works
- 8
BurwoodAustralia
42k works
- 9
NewcastleAustralia
41k works
- 10
HobartAustralia
37k works
- 11
TownsvilleAustralia
28k works
- 12
RichmondAustralia
25k works
How much of it is in the largest
The same cities as shares of everything these twelve account for.
Shares of the rows listed above, not of the whole node.
How open and international is Australia's research?
40% of its research is openly available (world: 40%), and 26% is written with international co-authors (world: 18%).
World: 40% of research is openly available.
World: 18% is written across borders.
In 2022-now, 65% of its research is openly available (world 63%) and 36% is written with co-authors abroad (world 22%). Against what its own mix of topics predicts, that is 1.04× the expected open access and 1.55× the expected international share, which puts it #121 of 173 countries on openness.
How has Australia's research grown?
Output in 2022-2025 was 3% lower than in 2018-2021.
The same series as a ribbon: one cell per year, darker for more. The line above answers how much; this answers when.
Its share of all research
Growing output can still be a shrinking share: all of science grows. This is Australia as a percentage of every work published that year, 1.5% in 2024.
Fractional works of Australia over all fractional works that year. How the balance of science has shifted.
How much of it reaches the world top 10%
Over the whole record, 13.2% of its 2.2M works since 1950 reached the world top 10% for their field and year.
Of each year's output, the share that reached the world's 10% most cited for its field and year. Peak 15.3% in 2024.
Which countries have research most like Australia's?
New Zealand is Australia's closest research twin: of all countries, its research is spread across the fields most like Australia's, with both strong in Psychology.
- 1
 New ZealandBoth strong in Psychology, Veterinary, Health Professions
0.85 Compare
- 2
 DenmarkBoth strong in Veterinary, Psychology, Neuroscience
0.85 Compare
- 3
 IrelandBoth strong in Health Professions, Veterinary, Psychology
0.84 Compare
- 4
 NetherlandsBoth strong in Psychology, Veterinary, Neuroscience
0.83 Compare
- 5
 CanadaBoth strong in Psychology, Health Professions, Veterinary
0.83 Compare
Similarity is the correlation of each side's location quotients across every field it publishes in, on a log scale: 1 is the same shape of research, 0 is unrelated. It ignores size. How it is measured.
Compare Australia with
 Switzerland
 France
 United Kingdom
 Spain
Share Australia's ranking
Badges for a website8Each links back here and updates with every snapshot
Its overall standing, then the domains, fields and subfields where Australia is in the world's top ten or its top 1%. Each has an image of its own.
Overall

Domains

Fields


Subfields


Research fields in Australia
- Environmental Science
- Engineering
- Physical Sciences
- Computer Science
- Psychology
- Health Professions
- Social Sciences
- Life Sciences
- Agricultural and Biological Sciences
- Social Sciences
- Sociology and Political Science
- Health Sciences
- Health, Toxicology and Mutagenesis
- Education
- Building and Construction
- Civil and Structural Engineering
- Electrical and Electronic Engineering
- Medicine
- Public Health, Environmental and Occupational Health
- Renewable Energy, Sustainability and the Environment
- Pediatrics, Perinatology and Child Health
- Information Systems
- Water Science and Technology
- Mechanical Engineering
- Clinical Psychology
- Social Psychology
- Artificial Intelligence
- Materials Science
- Economics and Econometrics
- Global and Planetary Change
- General Health Professions
- Business, Management and Accounting
- Control and Systems Engineering
- Economics, Econometrics and Finance
- Physiology
- Biochemistry, Genetics and Molecular Biology
- Earth and Planetary Sciences
- Plant Science
- Accounting
- Environmental Engineering
- Management Science and Operations Research
- Mechanics of Materials
- Nutrition and Dietetics
- Industrial and Manufacturing Engineering
- Gender Studies
- Organizational Behavior and Human Resource Management
- Food Science
- Health
- Energy
- Developmental and Educational Psychology
- Pollution
- Arts and Humanities
- Management Information Systems
- Computer Networks and Communications
- Ecology
- Media Technology
- Biomedical Engineering
- Computer Vision and Pattern Recognition
- Strategy and Management
- Decision Sciences
Questions people ask
Which cities in Australia are research hubs?
By research output, Melbourne, Sydney, Brisbane and Canberra.
See the full answerWhat is Australia strongest at in science?
On research quality in 2022-now, Australia ranks highest in Environmental Science (#4 of 122), Engineering (#5 of 131) and Computer Science (#6 of 128). Relative to its size it is most specialised in Research and Theory, Public Administration and Medical Terminology.
See the full answerWho are the top scientists in Australia?
Seyedali Mirjalili, Weng Marc Lim and Shulei Chou rank highest among researchers based in Australia.
Who are the top researchers in Australia?Discussion
Ask a question or share a note about Australia. Keep it to the research: no personal attacks, advertising or links. Any reader can report a post, which collapses it for everyone until it is opened.