Biomaterials research
Biomaterials is a subfield of Materials Science. Science Explorer counts 411k research works in it since 1950. 9.9% of them reached the world's top 10% most cited for their field and year.
In short: any substance that has been engineered to interact with biological systems for a medical purpose.
- Research works
- 411k fractional, since 1950
- In the world top 10%
- 41k per year above
- Top-10% rate
- 9.9% share of its works in the world top 10%
- Topics
- 13
- Growth, 2018-21 → 2022-25
- +24% the tick is no change
- Largest producer
 China
46% of the 10 largest, 2022-now
What is Biomaterials research about, and what is growing?
By the world's output in 2021-25, its most used keywords are Biomedical Applications, Nanocomposites, Drug Delivery, Tissue Engineering, Biodegradable Polymers, Biomaterials. Gaining share since 2011-15: Chitin, Chitosan, Cellulose Nanocrystals, Nanocellulose, Antioxidant. Losing share: Calotropis procera, Latex, Bioinspired Materials, Biomineralization.
- Latex
- Gelatin
- Peptide-Directed Materials
- Biomineralization
- Spider Silk
- Halloysite
- Supramolecular
- Magnesium Alloys
- Self-Assembly
- Cellulose Nanocrystals
- Chitin
- Antioxidant
- Nanocarriers
- Electrospinning
- Polyhydroxyalkanoates
- Biomaterials
- Tissue Engineering
- Nanocomposites
- Biomedical Applications
- Drug Delivery
- Biodegradable Polymers
- Nanofibers
- Polylactic Acid
- Polymer Nanofibers
- Nanoparticles
- Mechanical Properties
- Chitosan
- Nanocellulose
- Biodegradable Materials
- Peptide Amphiphiles
- Clay Nanotubes
- Silk Fibroin
- Bioinspired Materials
- Biomimetic Synthesis
- Collagen
- Calotropis procera
Size is the world's fractional works in 2021-25 in the topics tagged with each word; colour compares the word's share of this field with 2011-15. Each links to the topic it comes from most.
All 36 words, with their numbers
- Biomedical Applications87k◆ 1.09×7 topics
- Nanocomposites62k◆ 1.09×5 topics
- Drug Delivery46k◆ 0.98×4 topics
- Tissue Engineering46k◆ 1.10×5 topics
- Biodegradable Polymers32k▲ 1.22×2 topics
- Biomaterials27k◆ 1.09×4 topics
- Nanofibers26k◆ 0.99×2 topics
- Polyhydroxyalkanoates20k◆ 1.06×1 topic
- Polylactic Acid20k◆ 1.06×1 topic
- Electrospinning20k◆ 1.08×1 topic
- Polymer Nanofibers20k◆ 1.08×1 topic
- Nanocarriers15k◆ 0.94×1 topic
- Nanoparticles15k◆ 0.94×1 topic
- Antioxidant14k▲ 1.29×2 topics
- Mechanical Properties12k▼ 0.85×3 topics
- Chitin12k▲ 1.64×1 topic
- Chitosan12k▲ 1.64×1 topic
- Cellulose Nanocrystals11k▲ 1.30×1 topic
- Nanocellulose11k▲ 1.30×1 topic
- Self-Assembly9,991▼ 0.80×2 topics
- Biodegradable Materials6,408▼ 0.81×1 topic
- Magnesium Alloys6,408▼ 0.81×1 topic
- Peptide Amphiphiles6,210▼ 0.80×1 topic
- Supramolecular6,210▼ 0.80×1 topic
- Clay Nanotubes5,418▼ 0.83×1 topic
- Halloysite5,418▼ 0.83×1 topic
- Silk Fibroin5,386◆ 0.94×1 topic
- Spider Silk5,386◆ 0.94×1 topic
- Bioinspired Materials4,177▼ 0.78×1 topic
- Biomineralization4,177▼ 0.78×1 topic
- Biomimetic Synthesis3,780▼ 0.81×1 topic
- Peptide-Directed Materials3,780▼ 0.81×1 topic
- Collagen2,874▼ 0.80×1 topic
- Gelatin2,874▼ 0.80×1 topic
- Calotropis procera1,751▼ 0.52×1 topic
- Latex1,751▼ 0.52×1 topic
Which countries lead Biomaterials research?
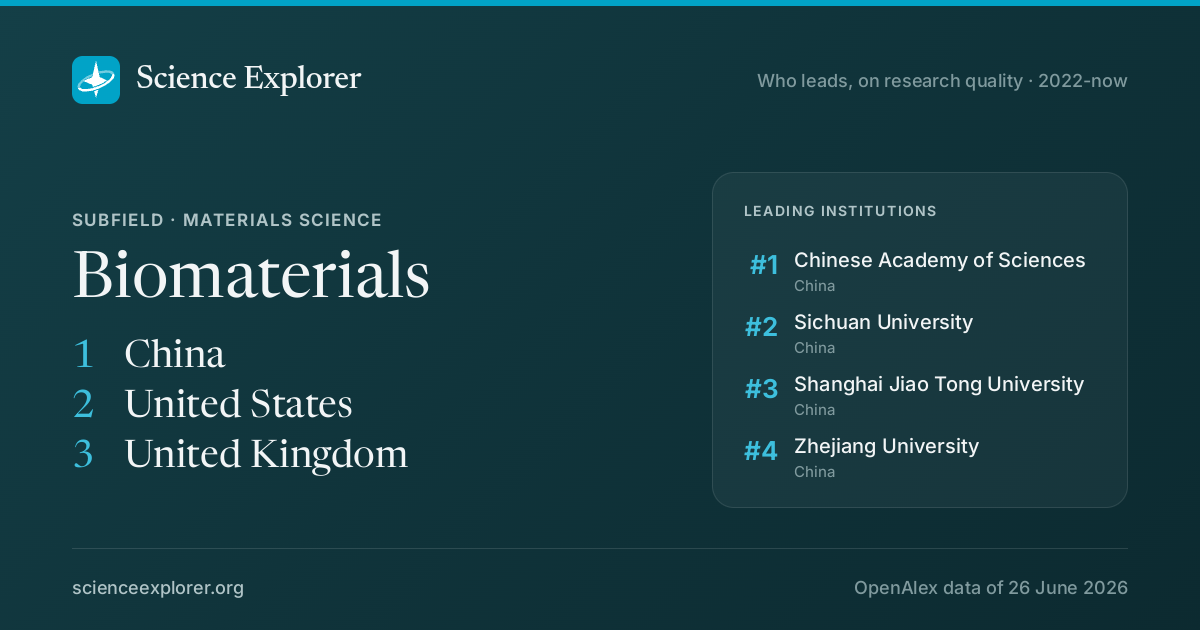
On research quality in 2022-now, China, the United States and the United Kingdom rank highest in Biomaterials. By volume, China and India publish the most (32k and 11k works in 2022-now).
By research quality, 2022-now
- 1
China #1 all time
1.33× citation excellence · 1.30× journals · 100% breadth
14.4% top 10% · 28k works
- 2
 United States #2 all time
0.97× citation excellence · 1.61× journals · 100% breadth
10.2% top 10% · 6.5k works
- 3
 United Kingdom #4 all time
1.10× citation excellence · 1.45× journals · 100% breadth
11.2% top 10% · 1.6k works
- 4
 Germany #3 all time
0.86× citation excellence · 1.42× journals · 100% breadth
7.7% top 10% · 2.1k works
- 5
 Canada #9 all time
1.13× citation excellence · 1.20× journals · 100% breadth
11.8% top 10% · 1.3k works
- 6
 South Korea #11 all time
1.02× citation excellence · 0.93× journals · 100% breadth
10.9% top 10% · 2.2k works
- 7
 Australia #7 all time
1.28× citation excellence · 1.21× journals · 100% breadth
14.4% top 10% · 942 works
- 8
 Spain #10 all time
1.06× citation excellence · 0.99× journals · 100% breadth
9.8% top 10% · 1.7k works
- 9
 France #5 all time
0.76× citation excellence · 1.25× journals · 100% breadth
7.0% top 10% · 1.9k works
- 10
 India #13 all time
0.85× citation excellence · 0.39× journals · 100% breadth
7.6% top 10% · 9.4k works
The track on each row is that row's top-10% rate. The ranking itself is the quality score, which compares the rate with what each place's own topics predict, adds its share of papers in the Nature Index journals, and counts output and breadth too.
Of 49 countries ranked in Biomaterials. Ranked on the quality score for 2022-now; the bracket is the all-time rank.
All countries ranked in BiomaterialsBy volume, 2022-now
- 1
China
32k works
- 2
India
11k works
- 3
United States
7.8k works
- 4
 Iran
3.4k works
- 5
 Japan
2.9k works
- 6
 Brazil
2.8k works
- 7
South Korea
2.6k works
- 8
 Indonesia
2.5k works
- 9
Germany
2.5k works
- 10
 Türkiye
2.4k works
How concentrated that is
The same countries as shares of everything the list above accounts for. A node where two countries do two thirds of the work and one spread evenly across twelve read alike as a ranking and not at all alike here.
Shares of the rows listed above, not of the whole node.
Which institutions lead Biomaterials research?
Chinese Academy of Sciences (China) ranks first in Biomaterials on research quality in 2022-now, followed by Sichuan University and Shanghai Jiao Tong University.
By research quality, 2022-now
- 1
Chinese Academy of Sciences China · Beijing · #1 all time
15.4% top 10% · 1.2k works
- 2
Sichuan University China · Chengdu · #5 all time
16.3% top 10% · 611 works
- 3
Shanghai Jiao Tong University China · Shanghai · #6 all time
17.8% top 10% · 412 works
- 4
Zhejiang University China · Hangzhou · #11 all time
17.5% top 10% · 372 works
- 5
Harvard University United States · Cambridge · #2 all time
17.4% top 10% · 108 works
- 6
University of Chinese Academy of Sciences China · Beijing · #3 all time
17.1% top 10% · 217 works
- 7
Chongqing University China · Chongqing · #15 all time
16.5% top 10% · 239 works
- 8
South China University of Technology China · Guangzhou · #14 all time
12.9% top 10% · 366 works
- 9
Peking University China · Beijing · #17 all time
17.4% top 10% · 167 works
- 10
Centre National de la Recherche Scientifique France · Paris · #4 all time
7.0% top 10% · 849 works


The track on each row is that row's top-10% rate. The ranking itself is the quality score, which compares the rate with what each place's own topics predict, adds its share of papers in the Nature Index journals, and counts output and breadth too.
Of 270 institutions above the floor of 40 fractional works in Biomaterials.
Top 100 Biomaterials institutionsBy volume, 2022-now
- 1
Chinese Academy of SciencesChina
1.4k works
- 2
Centre National de la Recherche ScientifiqueFrance
983 works
- 3
Russian Academy of Sciences
 Russia
958 works
- 4
Sichuan UniversityChina
667 works
- 5
Shanghai Jiao Tong UniversityChina
464 works
- 6
Islamic Azad University, TehranIran
434 works
- 7
Zhejiang UniversityChina
417 works
- 8
South China University of TechnologyChina
407 works
- 9
Chinese Academy of Agricultural SciencesChina
384 works
- 10
Nanjing Forestry UniversityChina
376 works

Who are the leading researchers in Biomaterials?
Counting only their work in Biomaterials, David Lee Kaplan, Seeram Ramakrishna and Róbert Langer have the most papers in the world top 10% for their subfield and year beyond the 10% expected.
- 1
David Lee Kaplan
United States · #20,404 worldwide overall
143.0 of 485 papers here in the top 10%
- 2
Seeram Ramakrishna
 Singapore · #2,487 worldwide overall
94.4 of 279 papers here in the top 10%
- 3
Róbert Langer
United States · #654 worldwide overall
72.2 of 152 papers here in the top 10%
- 4
Alain Dufresne
France · #79,755 worldwide overall
79.2 of 219 papers here in the top 10%
- 5
Yufeng Zheng
China · #8,273 worldwide overall
56.6 of 154 papers here in the top 10%
- 6
Ali Khademhosseini
United States · #1,961 worldwide overall
46.7 of 105 papers here in the top 10%
- 7
Kazunori Kataoka
Japan · #26,398 worldwide overall
46.8 of 134 papers here in the top 10%
- 8
Bin Ding
China · #4,003 worldwide overall
42.7 of 117 papers here in the top 10%
- 9
Orlando José Rojas
 Finland · #46,025 worldwide overall
54.0 of 245 papers here in the top 10%
- 10
Stephen F. Badylak
United States · #6,523 worldwide overall
36.2 of 77 papers here in the top 10%
Ranked on their work in Biomaterials alone: how many more of their papers here reached the world top 10% for their subfield and year than the 10% expected, among 1,124,457 ranked researchers with a paper here. Each paper counts once, so many strong papers outrank one famous one, and a long record of ordinary papers does not climb. Identities come from OpenAlex author disambiguation, which occasionally merges or splits people.
Top 100 Biomaterials researchersWhere is Biomaterials research done?
The largest centres of Biomaterials research in 2022-now are Beijing (China), Shanghai (China), Nanjing (China) and Guangzhou (China). Among places with at least 20 works in it, it is an unusually large share of all research in Pozzuoli and Iligan City.
Largest cities, 2022-now
Where it is the local speciality
- PozzuoliIT · 46.2 works19×
- Iligan CityPH · 147.6 works12×
Location quotient: how much more of its research is in Biomaterials than the world average.
Biomaterials research by country
The best places for Biomaterials research inside each country, with that country's researchers and world standing.
 Netherlands
 Denmark
 Belgium
 Portugal
 Poland
 Taiwan
 South Africa
 Thailand
 Greece
 Malaysia
 Argentina
 Mexico
 Egypt
 Vietnam
 Ukraine
 Iraq
Where is the best place to study Biomaterials?
Among universities, judged by research, Sichuan University, Shanghai Jiao Tong University and University of Chinese Academy of Sciences score highest, combining standing in the field's ranking, citation excellence, specialisation, size, growth and international reach. Research strength is one signal when choosing where to study; it does not measure teaching.
One dot per university in the first ten of the table below, at the default weights. The upper left is the interesting corner: small places doing unusually strong work.
| # | University | Score | Rank in field (all time) | Top 10% | Specialisation | Works | Growth |
|---|---|---|---|---|---|---|---|
| 1 | Sichuan UniversityChina |
80.5 | #2 (#5) | 16.0% | 3.2× | 668 | +20.3% |
| 2 | Shanghai Jiao Tong UniversityChina |
77.1 | #3 (#6) | 17.4% | 1.8× | 464 | +16.1% |
| 3 | University of Chinese Academy of SciencesChina |
76.2 | #6 (#3) | 16.6% | 1.6× | 247 | +3.9% |
| 4 | Harvard UniversityUnited States |
75.0 | #5 (#2) | 16.6% | 0.4× | 121 | -23.7% |
| 5 | Zhejiang UniversityChina |
71.7 | #4 (#11) | 16.6% | 1.7× | 417 | +19.6% |
| 6 | National University of SingaporeSingapore |
69.0 | #18 (#9) | 18.5% | 1.6× | 168 | +10.0% |
| 7 | Chongqing UniversityChina |
65.8 | #7 (#15) | 16.2% | 2.7× | 269 | +59.9% |
| 8 | University of Science and Technology of ChinaChina |
64.6 | #12 (#13) | 17.3% | 1.6× | 178 | +23.7% |
| 9 | South China University of TechnologyChina |
64.2 | #8 (#14) | 12.7% | 4.1× | 407 | +2.0% |
| 10 | Massachusetts Institute of TechnologyUnited States |
63.9 | #15 (#8) | 19.5% | 1.1× | 73 | -24.1% |
| 11 | Peking UniversityChina |
63.7 | #9 (#17) | 17.3% | 1.0× | 186 | +23.8% |
| 12 | ETH Zurich Switzerland |
62.1 | #22 (#7) | 14.0% | 1.4× | 85 | -11.3% |
| 13 | Tsinghua UniversityChina |
61.1 | #16 (#12) | 15.6% | 1.0× | 205 | +4.6% |
| 14 | Fudan UniversityChina |
60.4 | #19 (#19) | 15.0% | 1.5× | 218 | +25.7% |
| 15 | Nanjing Forestry UniversityChina |
59.7 | #24 (#39) | 14.6% | 9.1× | 376 | +57.2% |
| 16 | Jilin UniversityChina |
59.5 | #11 (#44) | 18.6% | 3.0× | 315 | +25.1% |
| 17 | Nankai UniversityChina |
58.9 | #14 (#21) | 17.1% | 2.4× | 152 | +11.1% |
| 18 | Wuhan UniversityChina |
58.8 | #21 (#20) | 20.7% | 1.2× | 154 | +8.4% |
| 19 | Donghua UniversityChina |
58.7 | #17 (#26) | 13.1% | 9.9× | 331 | +2.7% |
| 20 | Tongji UniversityChina |
56.5 | #20 (#31) | 16.3% | 1.3× | 177 | +34.9% |
| 21 | Nanjing UniversityChina |
55.2 | #13 (#34) | 16.7% | 1.6× | 134 | +40.0% |
| 22 | Nanyang Technological UniversitySingapore |
53.3 | #36 (#24) | 19.1% | 1.1× | 82 | -19.9% |
| 23 | Northwest A&F UniversityChina |
53.2 | #35 (#96) | 24.6% | 3.2× | 112 | +73.2% |
| 24 | Xi'an Jiaotong UniversityChina |
51.7 | #29 (#64) | 17.7% | 1.2× | 185 | +37.8% |
| 25 | Sun Yat-sen UniversityChina |
51.4 | #23 (#43) | 14.8% | 1.1× | 199 | +10.3% |
| 26 | Tianjin UniversityChina |
51.3 | #44 (#30) | 13.5% | 1.8× | 204 | -0.8% |
| 27 | China Agricultural UniversityChina |
50.4 | #42 (#86) | 19.6% | 2.4× | 121 | +91.2% |
| 28 | Harbin Institute of TechnologyChina |
49.6 | #34 (#60) | 15.3% | 1.2× | 183 | +21.8% |
| 29 | Cornell UniversityUnited States |
49.3 | #38 (#22) | 12.4% | 0.8× | 96 | -14.1% |
| 30 | University of TorontoCanada |
49.2 | #39 (#29) | 11.7% | 0.6× | 116 | -4.3% |
| 31 | Hunan UniversityChina |
49.0 | #28 (#63) | 21.4% | 1.5× | 96 | +12.1% |
| 32 | University of MichiganUnited States |
48.7 | #54 (#23) | 12.2% | 0.5× | 74 | +5.1% |
| 33 | Soochow UniversityChina |
48.1 | #41 (#52) | 10.3% | 3.1× | 276 | +4.0% |
| 34 | Huazhong University of Science and TechnologyChina |
47.8 | #37 (#77) | 15.4% | 1.2× | 192 | +25.4% |
| 35 | Jiangsu UniversityChina |
47.7 | #61 (#234) | 24.0% | 3.0× | 220 | +85.8% |
| 36 | Shandong UniversityChina |
47.6 | #26 (#73) | 12.2% | 1.8× | 212 | +30.0% |
| 37 | University of British ColumbiaCanada |
47.3 | #40 (#92) | 13.4% | 1.3× | 147 | +21.7% |
| 38 | Central South UniversityChina |
47.2 | #32 (#119) | 15.3% | 1.7× | 294 | +28.3% |
| 39 | City University of Hong KongChina |
46.9 | - (#74) | 23.5% | 1.0× | 54 | +31.2% |
| 40 | The University of QueenslandAustralia |
46.4 | #48 (#46) | 14.3% | 1.2× | 102 | -17.3% |
| 41 | Northeast Agricultural UniversityChina |
44.0 | #98 (#308) | 27.4% | 4.8× | 113 | +135.1% |
| 42 | University of Shanghai for Science and TechnologyChina |
43.9 | #123 (#236) | 29.5% | 2.3× | 90 | +80.1% |
| 43 | University of Hong KongChina |
43.1 | - (#62) | 19.3% | 0.8× | 64 | +2.2% |
| 44 | Kyung Hee UniversitySouth Korea |
42.7 | #115 (#254) | 23.2% | 2.8× | 104 | +11.1% |
| 45 | KTH Royal Institute of Technology Sweden |
42.2 | #85 (#67) | 10.0% | 3.9× | 135 | -19.6% |
| 46 | Jiangnan UniversityChina |
42.0 | #71 (#187) | 11.6% | 6.0× | 320 | +48.0% |
| 47 | Hong Kong Polytechnic UniversityChina |
39.1 | #62 (#202) | 17.8% | 1.0× | 77 | +12.6% |
| 48 | Tianjin University of Science and TechnologyChina |
37.8 | #109 (#252) | 17.5% | 9.1× | 159 | +3.7% |
| 49 | Southern University of Science and TechnologyChina |
37.5 | #25 | 23.4% | 1.4× | 68 | +132.8% |
| 50 | RMIT UniversityAustralia |
34.5 | - (#178) | 20.3% | 1.8× | 65 | -19.1% |
| 51 | Dalian Polytechnic UniversityChina |
34.1 | #173 (#498) | 18.2% | 9.8× | 155 | +105.1% |
| 52 | Shandong Agricultural UniversityChina |
33.0 | - (#445) | 23.5% | 3.8× | 62 | +63.4% |
| 53 | King Saud University Saudi Arabia |
32.6 | #204 (#514) | 11.1% | 2.1× | 186 | +73.4% |
| 54 | Wuhan Textile UniversityChina |
32.6 | #126 (#344) | 11.6% | 9.4× | 128 | +55.7% |
| 55 | National Interuniversity Consortium of Materials Science and Technology Italy |
31.9 | - (#214) | 12.5% | 15.8× | 57 | -5.3% |
| 56 | King Khalid UniversitySaudi Arabia |
28.1 | - | 15.5% | 1.9× | 64 | +135.9% |
| 57 | Islamic Azad University, TehranIran |
26.6 | #241 (#661) | 7.4% | 2.9× | 434 | +5.8% |
| 58 | Mindanao State University – Iligan Institute of Technology Philippines |
24.9 | - (#501) | 4.2% | 39.1× | 147 | +282.8% |
| 59 | Institute of Chemical TechnologyIndia |
21.3 | #228 (#645) | 8.1% | 10.3× | 86 | -1.8% |
| 60 | Technical University of Liberec Czechia |
20.8 | - (#598) | 6.1% | 12.9× | 61 | +16.2% |
| 61 | University of Tennessee at ChattanoogaUnited States |
13.9 | - | 4.5% | 12.1× | 57 | -8.2% |







Universities only. The score blends standing (50%), citation excellence (20%), size (15%), specialisation (5%), growth (5%), international reach (5%), 2022-now; growth compares 2018-21 with 2022-25 and counts up to +20%, since a jump from a small base is mostly noise. Standing is the score in this field's institution ranking, three quarters over all time and a quarter 2022-now; excellence averages the two windows too. Four years alone undercount fields such as AI, where many conference and arXiv papers from 2022 on carry no affiliation in the data.
Every institution in Biomaterials, country by countryIs Biomaterials research growing?
Output in 2022-2025 was 24% higher than in 2018-2021, peaking in 2025. The fastest-growing topics are Nanocomposite Films for Food Packaging, Diatoms and Algae Research and biodegradable polymer synthesis and properties.
The same series as a ribbon: one cell per year, darker for more. The line above answers how much; this answers when.
Its share of all research
Growing output can still be a shrinking share: all of science grows. This is Biomaterials as a percentage of every work published that year, 0.43% in 2024.
Fractional works of Biomaterials over all fractional works that year. How the balance of science has shifted.
How much of it reaches the world top 10%
Year by year.
Of each year's works in it, the share that reached the world's 10% most cited for their field and year. A field is the world for its own topics, so there is no other line to hold it against.
Which topics inside it are moving
Growth and decline on one axis around a shared zero. Two lists side by side hide the thing that matters: whether the growth dwarfs the decline, or the other way round.
- Nanocomposite Films for Food Packaging+49%
- Diatoms and Algae Research+49%
- biodegradable polymer synthesis and properties+37%
- Collagen: Extraction and Characterization+30%
- Advanced Cellulose Research Studies+28%
- Silk-based biomaterials and applications+26%
Growth in output from 2018-21 to 2022-25. Every topic is a page of its own.
What does Biomaterials include?
Area is fractional works in that topic. Every name below is a page of its own.
- Diatoms and Algae Research
- Clay minerals and soil interactions
- biodegradable polymer synthesis and properties
- Nanoparticle-Based Drug Delivery
- Electrospun Nanofibers in Biomedical Applications
- Advanced Cellulose Research Studies
- Phytochemistry and Bioactive Compounds
- Magnesium Alloys: Properties and Applications
- Calcium Carbonate Crystallization and Inhibition
- Nanocomposite Films for Food Packaging
- Supramolecular Self-Assembly in Materials
- Silk-based biomaterials and applications
- Collagen: Extraction and Characterization
Share who leads Biomaterials
The leading institutions' badges6Each links to that institution's page and updates with every snapshot


Discussion
Ask a question or share a note about Biomaterials. Keep it to the research: no personal attacks, advertising or links. Any reader can report a post, which collapses it for everyone until it is opened.