PowerChina (China)
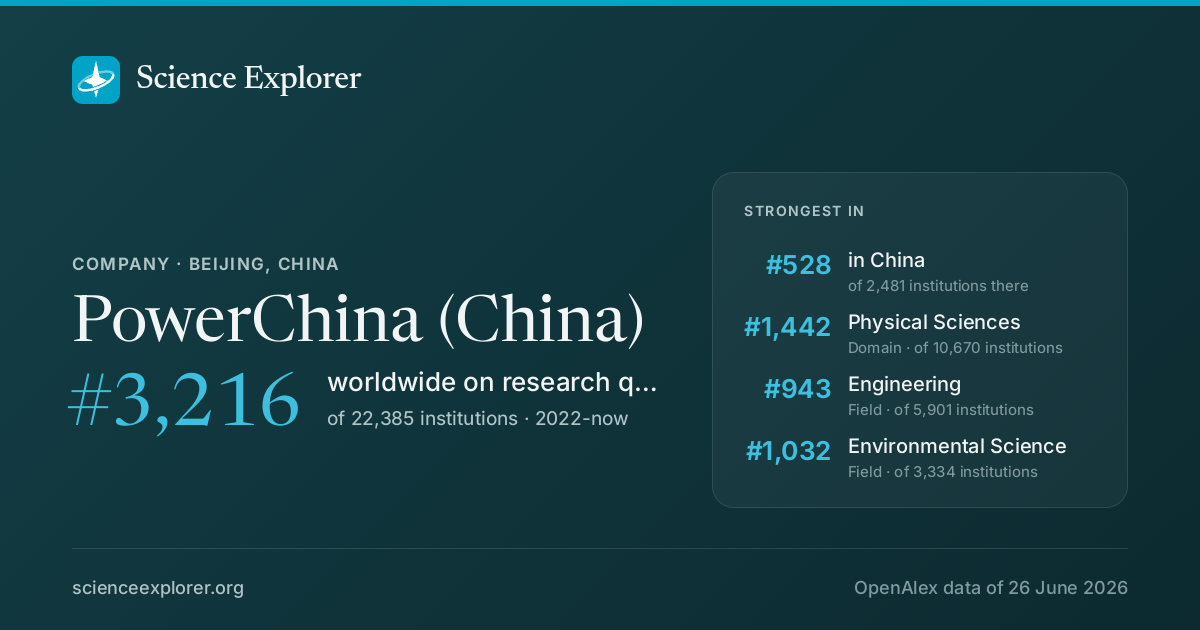
In research, PowerChina (China) stands highest in Physical Sciences (#1,442 of 10,670 worldwide), Engineering (#943 of 5,901 worldwide) and Environmental Science (#1,032 of 3,334 worldwide), 2022-now. Relative to its size it is most specialised in Energy Engineering and Power Technology, Civil and Structural Engineering and Safety, Risk, Reliability and Quality (Energy Engineering and Power Technology is 24.6× its share of world research).
- World rank, 2022-now
- #3,216 of 22,385 · #5,573 all time
- Rank in China
- #528 of 2,481
- Research works
- 3k ▲ 248% vs 2018-21
- Citations
- 20k 6.7 per fractional work
- Top-10% rate
- 8.2% all institutions 10.0%
- vs its own fields
- 0.92× 1.00× is exactly expected
- Open access
- 37% world 40%
- International
- 8% world 18%
What is PowerChina (China) known for in research?
The fields where it stands highest, 2022-now, ranked among every institution above the floor in each field.
| Field | World rank | Where that sits | Top-10% rate | Works | All time |
|---|---|---|---|---|---|
| Physical SciencesDomain | #1,442 of 10,670 | 8.1% | 1,528 | #2350 | |
| EngineeringField | #943 of 5,901 | 7.9% | 924 | #1871 | |
| Environmental ScienceField | #1,032 of 3,334 | 8.8% | 258 | #1824 | |
| Civil and Structural EngineeringSubfield | #287 of 908 | 8.4% | 254 | #569 | |
| Electrical and Electronic EngineeringSubfield | #1,061 of 2,176 | 5.9% | 189 | #1812 | |
| Mechanical EngineeringSubfield | #760 of 1,319 | 9.4% | 75 | #1456 | |
| Mechanics of MaterialsSubfield | #295 of 482 | 10.0% | 77 | #813 | |
| Computer ScienceField | #2,817 of 4,417 | 5.2% | 126 | #4026 | |
| Control and Systems EngineeringSubfield | #532 of 804 | 5.5% | 70 | #1272 | |
| Earth and Planetary SciencesField | #761 of 1,088 | 11.4% | 76 | #1402 |
Each strip is that field's whole ranked pool, with the notch where PowerChina (China) sits in it, in the colour of the band that rank falls in. The track under the rate is the rate itself: it carries no average mark, because the average differs by field (from about 6% in Dentistry to 21% in Economics).
Which of those standings moved
The same fields on both windows: where it stood over the whole record, and where it stands in 2022-now. The distance is the story, and it is the one thing the two rank columns above cannot show.
- Physical Sciences#2,350 #1,442
- Engineering#1,871 #943
- Environmental Science#1,824 #1,032
- Civil and Structural Engineering#569 #287
- Electrical and Electronic Engineering#1,812 #1,061
- Mechanical Engineering#1,456 #760
- Mechanics of Materials#813 #295
- Computer Science#4,026 #2,817
- Control and Systems Engineering#1,272 #532
- Earth and Planetary Sciences#1,402 #761
A dot further right is a better standing. Fields it was not ranked in over the whole record are left out.
Which fields of science does PowerChina (China) work in?
In 2022-now, 94% of research at PowerChina (China) is in Physical Sciences, 4% in Social Sciences. Its largest fields are Engineering (57%), Environmental Science (16%), Computer Science (7%). It does 2.4× the world's share of Physical Sciences.
Each ring splits the one inside it: the four domains of science, their fields, their subfields. Size is fractional works in 2022-now. Every slice is a page; the interactive view zooms down to single topics and colours each by how much more of it this institution does than the world.
Its 4 domains and 25 fields, with their numbers
- Physical Sciences1,76493.6%
- Engineering1,07857.2%
- Environmental Science29415.6%
- Computer Science1397.4%
- Earth and Planetary Sciences884.7%
- Energy874.6%
- Materials Science492.6%
- Physics and Astronomy100.6%
- Chemistry100.5%
- Chemical Engineering80.4%
- Mathematics10.1%
- Social Sciences733.9%
- Social Sciences321.7%
- Decision Sciences191.0%
- Business, Management and Accounting130.7%
- Economics, Econometrics and Finance50.3%
- Arts and Humanities20.1%
- Psychology20.1%
- Life Sciences311.7%
- Health Sciences160.8%
- Medicine100.5%
- Health Professions60.3%
- Nursing00.0%
- Dentistry00.0%
What does PowerChina (China) specialise in?
Where its research is concentrated relative to its size: Energy Engineering and Power Technology takes 24.6× the share of its output that it takes of world research.
- Energy Engineering and Power TechnologySubfield · 50.1 works25×
- Civil and Structural EngineeringSubfield · 303.9 works14×
- Safety, Risk, Reliability and QualitySubfield · 57.5 works13×
- Mechanics of MaterialsSubfield · 93.5 works7.0×
- Ocean EngineeringSubfield · 52.5 works5.4×
- Environmental EngineeringSubfield · 53.4 works5.2×
Location quotient, a volume reading rather than an impact one. It surfaces small, lopsided specialities.
Field profile
Location quotient across every field it publishes in: outside the ring is more than an institution of this size would be expected to publish, inside it is less.
Rings at 0.5×, 1× and 2×. Widest outward: Energy, 5.0×. Every wedge is a field page.
All 25 fields, with their numbers
- Energy5.01×87 works
- Engineering3.81×1,078 works
- Environmental Science3.14×294 works
- Earth and Planetary Sciences2.98×88 works
- Chemical Engineering1.17×8 works
- Decision Sciences1.04×19 works
- Computer Science0.95×139 works
- Materials Science0.75×49 works
- Chemistry0.33×10 works
- Agricultural and Biological Sciences0.25×22 works
- Physics and Astronomy0.25×10 works
- Business, Management and Accounting0.21×13 works
- Economics, Econometrics and Finance0.13×5 works
- Social Sciences0.13×32 works
- Health Professions0.12×6 works
- Biochemistry, Genetics and Molecular Biology0.07×7 works
- Pharmacology, Toxicology and Pharmaceutics0.07×0 works
- Mathematics0.06×1 works
- Immunology and Microbiology0.05×1 works
- Neuroscience0.04×1 works
- Arts and Humanities0.04×2 works
- Medicine0.03×10 works
- Nursing0.03×0 works
- Psychology0.03×2 works
- Dentistry0.01×0 works
- Energy 5.0×
- Engineering 3.8×
- Environmental Science 3.1×
- Earth and Planetary Sciences 3.0×
- Chemical Engineering 1.2×
- Decision Sciences 1.0×
- Computer Science 0.9×
- Materials Science 0.8×
- Chemistry 0.3×
- Agricultural and Biological Sciences 0.2×
- Physics and Astronomy 0.2×
- Business, Management and Accounting 0.2×
- Economics, Econometrics and Finance 0.1×
- Social Sciences 0.1×
- Health Professions 0.1×
- Biochemistry, Genetics and Molecular Biology 0.1×
- Pharmacology, Toxicology and Pharmaceutics 0.1×
- Mathematics 0.1×
- Immunology and Microbiology 0.1×
- Neuroscience 0.0×
- Arts and Humanities 0.0×
- Medicine 0.0×
- Nursing 0.0×
- Psychology 0.0×
- Dentistry 0.0×
Who are the top researchers at PowerChina (China)?
Ranked on the quality score, Jingjing He, Shishu Zhang and Ming Sun lead among researchers whose main affiliation is PowerChina (China).
- 1
Jingjing He
 China · #612,417 worldwide
1.6k citations · 57 works
- 2
Shishu Zhang
China · #782,364 worldwide
2k citations · 96 works
- 3
Ming Sun
China · #1,273,750 worldwide
181 citations · 18 works
- 4
Huaiwu Peng
China · #1,305,332 worldwide
707 citations · 56 works
- 5
Qingfu Huang
China · #1,712,864 worldwide
301 citations · 22 works
- 6
Yelin Feng
China · #1,861,547 worldwide
85 citations · 25 works
- 7
Heng Zhou
China · #1,926,928 worldwide
1.3k citations · 116 works
- 8
Xiaomei Kou
China · #1,946,077 worldwide
167 citations · 23 works
- 9
Shuwu Li
China · #2,471,394 worldwide
270 citations · 57 works
- 10
Xiaojie Zhuang
China · #2,537,241 worldwide
568 citations · 17 works
Which keywords describe research at PowerChina (China)?
By fractional works in 2022-now, weighted toward what it does more of than the world: Renewable Energy, Smart Grid, Remote Sensing, Environmental Impact, Risk Assessment, Energy Storage, Numerical Simulation and Reliability Analysis.
- Slope Stability Analysis
- Seismic
- Bayesian Optimization
- Spatial Variability
- Numerical Modelling
- Acoustic Emission
- Frequency Regulation
- Power Systems
- Fracture
- Wind Power
- Grid Integration
- Hazard
- Finite Element Analysis
- Rock Mechanics
- Liquefaction
- Numerical Simulation
- Risk Assessment
- Climate Change
- Deep Learning
- Remote Sensing
- Renewable Energy
- Smart Grid
- Environmental Impact
- Machine Learning
- Energy Storage
- Reliability Analysis
- Tunnel
- GIS-based Modeling
- Power System
- Landslide
- Battery Technology
- Dynamic Behavior
- Analysis
- Pipeline
- Soil Properties
- Brittle Failure
- Photovoltaic Generation
- Seismic Analysis
- Earthquake
- Probabilistic Methods
Size is fractional works in 2022-now in the topics tagged with each word; colour is the word's share of this institution's work against its share of the world's. The 40 words are chosen for being large and distinctive. Each links to the topic it comes from most.
All 40 words, with their numbers
- Renewable Energy202▲ 7.4×39 topics
- Remote Sensing134▲ 5.8×35 topics
- Smart Grid122▲ 18×9 topics
- Deep Learning119▲ 1.83×72 topics
- Environmental Impact114▲ 3.5×43 topics
- Climate Change106▲ 2.1×63 topics
- Machine Learning101▲ 1.60×62 topics
- Risk Assessment81▲ 6.5×14 topics
- Energy Storage80▲ 6.5×12 topics
- Numerical Simulation72▲ 13×14 topics
- Reliability Analysis63▲ 33×4 topics
- Liquefaction61▲ 38×2 topics
- Tunnel61▲ 38×2 topics
- Rock Mechanics59▲ 32×4 topics
- GIS-based Modeling58▲ 37×2 topics
- Finite Element Analysis57▲ 13×8 topics
- Power System55▲ 35×5 topics
- Hazard53▲ 41×1 topic
- Landslide53▲ 41×1 topic
- Grid Integration52▲ 27×3 topics
- Battery Technology52▲ 9.9×3 topics
- Wind Power50▲ 28×4 topics
- Dynamic Behavior48▲ 22×3 topics
- Fracture46▲ 25×2 topics
- Analysis46▲ 27×3 topics
- Power Systems45▲ 23×2 topics
- Pipeline43▲ 22×3 topics
- Frequency Regulation43▲ 41×2 topics
- Soil Properties43▲ 13×5 topics
- Acoustic Emission41▲ 35×2 topics
- Brittle Failure41▲ 37×1 topic
- Numerical Modelling41▲ 37×1 topic
- Photovoltaic Generation41▲ 54×1 topic
- Spatial Variability41▲ 33×2 topics
- Seismic Analysis40▲ 55×2 topics
- Bayesian Optimization39▲ 25×2 topics
- Earthquake39▲ 37×1 topic
- Seismic39▲ 37×1 topic
- Probabilistic Methods39▲ 53×1 topic
- Slope Stability Analysis39▲ 53×1 topic
Which research topics does PowerChina (China) publish most on?
By volume in 2022-now: Landslides and related hazards, Rock Mechanics and Modeling, Power Systems and Renewable Energy and Geotechnical Engineering and Underground Structures.
Area is fractional works; colour is the subfield each topic belongs to.
- 1 Landslides and related hazards Management, Monitoring, Policy and Law 53 works
- 2 Rock Mechanics and Modeling Mechanics of Materials 41 works
- 3 Power Systems and Renewable Energy Energy Engineering and Power Technology 41 works
- 4 Geotechnical Engineering and Underground Structures Civil and Structural Engineering 39 works
- 5 Geotechnical Engineering and Analysis Safety, Risk, Reliability and Quality 39 works
- 6 Dam Engineering and Safety Civil and Structural Engineering 38 works
- 7 Power Systems and Technologies Electrical and Electronic Engineering 24 works
- 8 Smart Grid and Power Systems Electrical and Electronic Engineering 24 works
- 9 Grouting, Rheology, and Soil Mechanics Civil and Structural Engineering 22 works
- 10 Geotechnical Engineering and Soil Stabilization Civil and Structural Engineering 21 works
How open and international is its research?
Against the world's own shares: the tick on each track. Both are shares of its output, so they sit on one scale and can be read against each other as well as against the world.
World: 40% of research is openly available.
World: 18% is written across borders.
How has PowerChina (China)'s research output changed?
Output in 2022-2025 was 248% higher than in 2018-2021.
The same series as a ribbon: one cell per year, darker for more. The line above answers how much; this answers when.
Its share of all research
Growing output can still be a shrinking share: all of science grows. This is PowerChina (China) as a percentage of every work published that year, 0.0090% in 2024.
Fractional works of PowerChina (China) over all fractional works that year. How the balance of science has shifted.
How much of it reaches the world top 10%
Year by year, against all institutions in the same year.
Of each year's output, the share that reached the world's 10% most cited for its field and year. Peak 18.2% in 2005.
Other research institutions in Beijing
- Chinese Academy of Sciences
- Tsinghua University
- Peking University
- Chinese Academy of Agricultural Sciences
- University of Chinese Academy of Sciences
- Beihang University
- Beijing Institute of Technology
- Capital Medical University

Share PowerChina (China)'s ranking
Badges for a website1Each links back here and updates with every snapshot

Research measures only: rankings here say nothing about teaching, admissions or student experience. Comparable institutions and collaboration partners have tabs of their own, above.
Discussion
Ask a question or share a note about PowerChina (China). Posts are plain text and can be reported.