Science Explorer Back to mapMap
Discussion

Applied Sciences (United States)

In research, Applied Sciences (United States) stands highest in Physical Sciences (#15,456 of 17,446 worldwide) and Life Sciences (#10,610 of 11,023 worldwide), over all time.

World rank, all time
#25,212
of 34,923
Rank in United States
#5,261
of 7,310
Research works
643
◆ 2% vs 2018-21
Citations
6.6k
10.2 per fractional work
Top-10% rate
4.7%
all institutions 10.0%
vs its own fields
0.69×
1.00× is exactly expected
Open access
17%
world 40%
International
14%
world 18%

What is Applied Sciences (United States) known for in research?

The fields where it stands highest, over all time, ranked among every institution above the floor in each field.

FieldWorld rankWhere that sitsTop-10% rateWorks
Physical SciencesDomain #15,456 of 17,446 9.0%350
Life SciencesDomain #10,610 of 11,023 3.8%121

Each strip is that field's whole ranked pool, with the notch where Applied Sciences (United States) sits in it, in the colour of the band that rank falls in. The track under the rate is the rate itself: it carries no average mark, because the average differs by field (from about 6% in Dentistry to 21% in Economics).

Which fields of science does Applied Sciences (United States) work in?

In 2022-now, 70% of research at Applied Sciences (United States) is in Physical Sciences, 21% in Social Sciences. Its largest fields are Engineering (34%), Computer Science (17%), Business, Management and Accounting (8%). It does 1.7× the world's share of Physical Sciences.

Physical Sciences: 27 fractional works · 69.8% of its workEngineering: 13 fractional works · 33.8% of its workAerospace Engineering: 2 fractional works · 5.5% of its workIndustrial and Manufacturing Engineering: 2 fractional works · 4.1% of its workElectrical and Electronic Engineering: 1 fractional works · 3.8% of its workAutomotive Engineering: 1 fractional works · 3.4% of its workComputational Mechanics: 1 fractional works · 3.4% of its workMechanical Engineering: 1 fractional works · 3.1% of its workCivil and Structural Engineering: 1 fractional works · 3.0% of its workBiomedical Engineering: 1 fractional works · 2.1% of its workMechanics of Materials: 1 fractional works · 1.5% of its workBuilding and Construction: 0 fractional works · 1.2% of its workMedia Technology: 0 fractional works · 1.1% of its workControl and Systems Engineering: 0 fractional works · 1.1% of its workOcean Engineering: 0 fractional works · 0.4% of its workSafety, Risk, Reliability and Quality: 0 fractional works · 0.2% of its workComputer Science: 6 fractional works · 16.9% of its workInformation Systems: 2 fractional works · 6.3% of its workArtificial Intelligence: 2 fractional works · 4.2% of its workComputer Networks and Communications: 1 fractional works · 2.9% of its workComputer Vision and Pattern Recognition: 1 fractional works · 1.5% of its workComputer Science Applications: 0 fractional works · 0.7% of its workSignal Processing: 0 fractional works · 0.6% of its workComputer Graphics and Computer-Aided Design: 0 fractional works · 0.3% of its workHardware and Architecture: 0 fractional works · 0.2% of its workHuman-Computer Interaction: 0 fractional works · 0.2% of its workMathematics: 1 fractional works · 3.7% of its workNumerical Analysis: 1 fractional works · 1.8% of its workModeling and Simulation: 0 fractional works · 0.9% of its workApplied Mathematics: 0 fractional works · 0.7% of its workGeometry and Topology: 0 fractional works · 0.3% of its workEnvironmental Science: 1 fractional works · 3.5% of its workEcology: 0 fractional works · 1.2% of its workIndustrial and Manufacturing Engineering: 0 fractional works · 0.7% of its workEnvironmental Engineering: 0 fractional works · 0.5% of its workHealth, Toxicology and Mutagenesis: 0 fractional works · 0.5% of its workGlobal and Planetary Change: 0 fractional works · 0.4% of its workPollution: 0 fractional works · 0.2% of its workSmaller subfields together: 0 fractional works · 0.1% of its workPhysics and Astronomy: 1 fractional works · 2.8% of its workAstronomy and Astrophysics: 1 fractional works · 1.6% of its workStatistical and Nonlinear Physics: 0 fractional works · 0.9% of its workAtomic and Molecular Physics, and Optics: 0 fractional works · 0.3% of its workSmaller subfields together: 0 fractional works · 0.0% of its workMaterials Science: 1 fractional works · 2.6% of its workMaterials Chemistry: 1 fractional works · 2.4% of its workPolymers and Plastics: 0 fractional works · 0.3% of its workEnergy: 1 fractional works · 2.2% of its workEnergy Engineering and Power Technology: 0 fractional works · 1.3% of its workRenewable Energy, Sustainability and the Environment: 0 fractional works · 0.6% of its workFuel Technology: 0 fractional works · 0.3% of its workEarth and Planetary Sciences: 1 fractional works · 2.1% of its workEarth-Surface Processes: 0 fractional works · 0.6% of its workGeology: 0 fractional works · 0.6% of its workOceanography: 0 fractional works · 0.5% of its workAtmospheric Science: 0 fractional works · 0.4% of its workChemistry: 0 fractional works · 1.1% of its workOrganic Chemistry: 0 fractional works · 0.9% of its workPhysical and Theoretical Chemistry: 0 fractional works · 0.2% of its workSmaller subfields together: 0 fractional works · 0.0% of its workChemical Engineering: 0 fractional works · 1.0% of its workFluid Flow and Transfer Processes: 0 fractional works · 0.9% of its workSmaller subfields together: 0 fractional works · 0.2% of its workSocial Sciences: 8 fractional works · 20.7% of its workBusiness, Management and Accounting: 3 fractional works · 8.1% of its workStrategy and Management: 1 fractional works · 3.6% of its workManagement Information Systems: 1 fractional works · 2.1% of its workManagement of Technology and Innovation: 0 fractional works · 1.2% of its workOrganizational Behavior and Human Resource Management: 0 fractional works · 0.7% of its workAccounting: 0 fractional works · 0.3% of its workMarketing: 0 fractional works · 0.2% of its workSocial Sciences: 3 fractional works · 7.9% of its workEducation: 1 fractional works · 1.9% of its workLaw: 0 fractional works · 1.3% of its workPolitical Science and International Relations: 0 fractional works · 1.3% of its workSociology and Political Science: 0 fractional works · 1.2% of its workUrban Studies: 0 fractional works · 1.0% of its workLibrary and Information Sciences: 0 fractional works · 0.9% of its workSafety Research: 0 fractional works · 0.2% of its workPsychology: 1 fractional works · 2.6% of its workSocial Psychology: 0 fractional works · 0.9% of its workDevelopmental and Educational Psychology: 0 fractional works · 0.8% of its workApplied Psychology: 0 fractional works · 0.4% of its workExperimental and Cognitive Psychology: 0 fractional works · 0.4% of its workDecision Sciences: 0 fractional works · 1.0% of its workManagement Science and Operations Research: 0 fractional works · 0.7% of its workInformation Systems and Management: 0 fractional works · 0.3% of its workArts and Humanities: 0 fractional works · 0.9% of its workArcheology: 0 fractional works · 0.6% of its workSmaller subfields together: 0 fractional works · 0.4% of its workEconomics, Econometrics and Finance: 0 fractional works · 0.2% of its workLife Sciences: 2 fractional works · 6.5% of its workBiochemistry, Genetics and Molecular Biology: 1 fractional works · 2.7% of its workGenetics: 1 fractional works · 1.7% of its workMolecular Biology: 0 fractional works · 0.7% of its workBiotechnology: 0 fractional works · 0.3% of its workAgricultural and Biological Sciences: 1 fractional works · 2.3% of its workAgronomy and Crop Science: 0 fractional works · 0.9% of its workInsect Science: 0 fractional works · 0.5% of its workFood Science: 0 fractional works · 0.4% of its workGeneral Agricultural and Biological Sciences: 0 fractional works · 0.3% of its workPlant Science: 0 fractional works · 0.2% of its workSmaller subfields together: 0 fractional works · 0.0% of its workNeuroscience: 0 fractional works · 1.3% of its workCognitive Neuroscience: 0 fractional works · 0.9% of its workSmaller subfields together: 0 fractional works · 0.3% of its workPharmacology, Toxicology and Pharmaceutics: 0 fractional works · 0.2% of its workPharmacology: 0 fractional works · 0.2% of its workHealth Sciences: 1 fractional works · 3.0% of its workMedicine: 1 fractional works · 2.3% of its workInfectious Diseases: 0 fractional works · 0.5% of its workNeurology: 0 fractional works · 0.3% of its workPublic Health, Environmental and Occupational Health: 0 fractional works · 0.3% of its workSurgery: 0 fractional works · 0.3% of its workPhysiology: 0 fractional works · 0.2% of its workSmaller subfields together: 0 fractional works · 0.7% of its workHealth Professions: 0 fractional works · 0.7% of its workGeneral Health Professions: 0 fractional works · 0.7% of its workALL ITS WORKApplied Sciences(United States)38fractional works, 2022-now
Life Sciences6%Physical Sciences70%Health Sciences3%Social Sciences21%

Each ring splits the one inside it: the four domains of science, their fields, their subfields. Size is fractional works in 2022-now. Every slice is a page; the interactive view zooms down to single topics and colours each by how much more of it this institution does than the world.

Its 4 domains and 22 fields, with their numbers
    1. Engineering1333.8%
    2. Computer Science616.9%
    3. Mathematics13.7%
    4. Environmental Science13.5%
    5. Physics and Astronomy12.8%
    6. Materials Science12.6%
    7. Energy12.2%
    8. Earth and Planetary Sciences12.1%
    9. Chemistry01.1%
    10. Chemical Engineering01.0%
    1. Business, Management and Accounting38.1%
    2. Social Sciences37.9%
    3. Psychology12.6%
    4. Decision Sciences01.0%
    5. Arts and Humanities00.9%
    6. Economics, Econometrics and Finance00.2%
    1. Biochemistry, Genetics and Molecular Biology12.7%
    2. Agricultural and Biological Sciences12.3%
    3. Neuroscience01.3%
    4. Pharmacology, Toxicology and Pharmaceutics00.2%
    1. Medicine12.3%
    2. Health Professions00.7%
All of science, and how each field's share has moved since 1950: the Science domain explorer

Field profile

Location quotient across every field it publishes in: outside the ring is more than an institution of this size would be expected to publish, inside it is less.

Agricultural and Biological Sciences: 0.49× its world share, 1 worksAgricultural and Bio…Biochemistry, Genetics and Molecular Biology: 0.50× its world share, 1 worksBiochemistry, Geneti…Neuroscience: 0.77× its world share, 0 worksNeurosciencePharmacology, Toxicology and Pharmaceutics: 0.62× its world share, 0 worksPharmacology, Toxico…Chemical Engineering: 3.00× its world share, 0 worksChemical EngineeringChemistry: 0.70× its world share, 0 worksChemistryComputer Science: 2.18× its world share, 6 worksComputer ScienceEarth and Planetary Sciences: 1.37× its world share, 1 worksEarth and Planetary …Energy: 2.38× its world share, 1 worksEnergyEngineering: 2.25× its world share, 13 worksEngineeringEnvironmental Science: 0.71× its world share, 1 worksEnvironmental ScienceMaterials Science: 0.76× its world share, 1 worksMaterials ScienceMathematics: 3.15× its world share, 1 worksMathematicsPhysics and Astronomy: 1.24× its world share, 1 worksPhysics and AstronomyHealth Professions: 0.28× its world share, 0 worksHealth ProfessionsMedicine: 0.12× its world share, 1 worksMedicineArts and Humanities: 0.32× its world share, 0 worksArts and HumanitiesBusiness, Management and Accounting: 2.53× its world share, 3 worksBusiness, Management…Decision Sciences: 1.05× its world share, 0 worksDecision SciencesEconomics, Econometrics and Finance: 0.09× its world share, 0 worksEconomics, Econometr…Psychology: 0.84× its world share, 1 worksPsychologySocial Sciences: 0.62× its world share, 3 worksSocial Sciences1×world share
more than its size predictsabout as predictedless

Rings at 0.5×, 1× and 2×. Widest outward: Mathematics, 3.1×. Every wedge is a field page.

All 22 fields, with their numbers
  1. Mathematics3.15×1 works
  2. Chemical Engineering3.00×0 works
  3. Business, Management and Accounting2.53×3 works
  4. Energy2.38×1 works
  5. Engineering2.25×13 works
  6. Computer Science2.18×6 works
  7. Earth and Planetary Sciences1.37×1 works
  8. Physics and Astronomy1.24×1 works
  9. Decision Sciences1.05×0 works
  10. Psychology0.84×1 works
  11. Neuroscience0.77×0 works
  12. Materials Science0.76×1 works
  13. Environmental Science0.71×1 works
  14. Chemistry0.70×0 works
  15. Pharmacology, Toxicology and Pharmaceutics0.62×0 works
  16. Social Sciences0.62×3 works
  17. Biochemistry, Genetics and Molecular Biology0.50×1 works
  18. Agricultural and Biological Sciences0.49×1 works
  19. Arts and Humanities0.32×0 works
  20. Health Professions0.28×0 works
  21. Medicine0.12×1 works
  22. Economics, Econometrics and Finance0.09×0 works

Who are the top researchers at Applied Sciences (United States)?

Ranked on the quality score, Sterghios Athanasios Moschos, David J. Burton and Robert Judson Clark lead among researchers whose main affiliation is Applied Sciences (United States).

  1. 1 Sterghios Athanasios Moschos United States · #1,896,147 worldwide 3.4k citations · 113 works
  2. 2 David J. Burton United States · #3,128,237 worldwide 1.5k citations · 50 works
  3. 3 Robert Judson Clark United States · #3,130,583 worldwide 96 citations · 22 works
  4. 4 Max L. Lake United States · #4,265,216 worldwide 1.4k citations · 57 works
  5. 5 José Pérez Alonso United States · #6,466,838 worldwide 7 citations · 29 works
  6. 6 Sara Sulaiman United States · #6,854,634 worldwide 122 citations · 44 works
  7. 7 Martin Evison United States · #6,946,092 worldwide 1k citations · 201 works
All ranked researchers at Applied Sciences (United States)

What are the most cited papers from Applied Sciences (United States)?

The most cited paper from Applied Sciences (United States) is "A review of the fabrication and properties of vapor-grown carbon nanofiber/polymer composites" (Gary G. Tibbetts, Max L. Lake, Karla L Strong et al., 2006), with 630 citations. Next come "Extent and Degree of Shoreline Oiling: Deepwater Horizon Oil Spill, Gulf of Mexico, USA" (413) and "Co@NH 2 -MIL-125(Ti): cobaloxime-derived metal–organic framework-based composite for light-driven H 2 production" (406).

Most cited papers
#PaperReleasedCitations
1 A review of the fabrication and properties of vapor-grown carbon nanofiber/polymer composites Gary G. Tibbetts, Max L. Lake, Karla L Strong et al. · Composites Science and Technology 8 Sep 2006 630
2 Extent and Degree of Shoreline Oiling: Deepwater Horizon Oil Spill, Gulf of Mexico, USA Jacqueline Michel, Edward H. Owens, Scott A. Zengel et al. · PLoS ONE Open access 12 Jun 2013 413
3 Co@NH 2 -MIL-125(Ti): cobaloxime-derived metal–organic framework-based composite for light-driven H 2 production Maxim A. Nasalevich, René Becker, Enrique V. Ramos–Fernández et al. · Energy & Environmental Science Open access 19 Nov 2014 406
4 HYADES—A plasma hydrodynamics code for dense plasma studies Jon Thorsten Larsen, Stephen M. Lane · Journal of Quantitative Spectroscopy and Radiative Transfer 1994 369
5 Polar Stratospheric Cloud Sightings by SAM II Michael P. McCormick, H. Meili Steele, Patrick Hamill et al. · Journal of the Atmospheric Sciences Jun 1982 334
All 62 most cited papers, with filters and sorting

Which keywords describe research at Applied Sciences (United States)?

By fractional works in 2022-now, weighted toward what it does more of than the world: Security, Privacy, Supply Chain Management, Anomaly Detection, Blockchain, CNC Systems, Distributed Systems and Machine Tools.

▲ more of its work than of the world's◆ about the world's share▼ less than the world's

Size is fractional works in 2022-now in the topics tagged with each word; colour is the word's share of this institution's work against its share of the world's. The 15 words are chosen for being large and distinctive. Each links to the topic it comes from most.

All 15 words, with their numbers
  1. Machine Learning2▲ 1.60×10 topics
  2. Deep Learning2▲ 1.35×10 topics
  3. Security2▲ 6.6×5 topics
  4. Sustainability2▲ 1.85×10 topics
  5. Environmental Impact2▲ 2.4×9 topics
  6. Renewable Energy2▲ 2.8×6 topics
  7. Supply Chain Management2▲ 4.8×5 topics
  8. Internet of Things1▲ 3.8×3 topics
  9. Privacy1▲ 12×3 topics
  10. Healthcare1▲ 2.8×3 topics
  11. Anomaly Detection1▲ 10×4 topics
  12. Blockchain1▲ 12×2 topics
  13. CNC Systems1▲ 93×1 topic
  14. Distributed Systems1▲ 15×4 topics
  15. Machine Tools1▲ 40×1 topic

Which research topics does Applied Sciences (United States) publish most on?

By volume in 2022-now: Engineering Technology and Methodologies, Blockchain Technology Applications and Security, Advanced Numerical Analysis Techniques and Iterative Methods for Nonlinear Equations.

  1. 1 Engineering Technology and Methodologies Industrial and Manufacturing Engineering 1 works
  2. 2 Blockchain Technology Applications and Security Information Systems 1 works
  3. 3 Advanced Numerical Analysis Techniques Computational Mechanics 1 works
  4. 4 Iterative Methods for Nonlinear Equations Numerical Analysis 1 works
  5. 5 Software System Performance and Reliability Computer Networks and Communications 1 works
  6. 6 Autonomous Vehicle Technology and Safety Automotive Engineering 0 works
  7. 7 Business Strategy and Innovation Strategy and Management 0 works
  8. 8 Wind Energy Research and Development Aerospace Engineering 0 works
  9. 9 Scheduling and Optimization Algorithms Industrial and Manufacturing Engineering 0 works
  10. 10 Historical Astronomy and Related Studies Astronomy and Astrophysics 0 works

How open and international is its research?

Against the world's own shares: the tick on each track. Both are shares of its output, so they sit on one scale and can be read against each other as well as against the world.

openly available17.1%not open82.9%

World: 40% of research is openly available.

with international co-authors14.5%domestic only85.5%

World: 18% is written across borders.

How has Applied Sciences (United States)'s research output changed?

Output in 2022-2025 was 2% higher than in 2018-2021.

still counting1990200020102020
grewheldshrank

The same series as a ribbon: one cell per year, darker for more. The line above answers how much; this answers when.

Its share of all research

Growing output can still be a shrinking share: all of science grows. This is Applied Sciences (United States) as a percentage of every work published that year, 0.00014% in 2024.

still counting0.0020%0.0040%Applied Sciences (United States)0.000036% in 202519801990200020102020

Fractional works of Applied Sciences (United States) over all fractional works that year. How the balance of science has shifted.

How much of it reaches the world top 10%

Year by year, against all institutions in the same year.

5%10%all institutions10.0% in 2016Applied Sciences (United States)1.6% in 20162010

Of each year's output, the share that reached the world's 10% most cited for its field and year. Peak 7.2% in 2012.

Other research institutions in Cedarville

All research institutions in Cedarville

Share Applied Sciences (United States)'s ranking
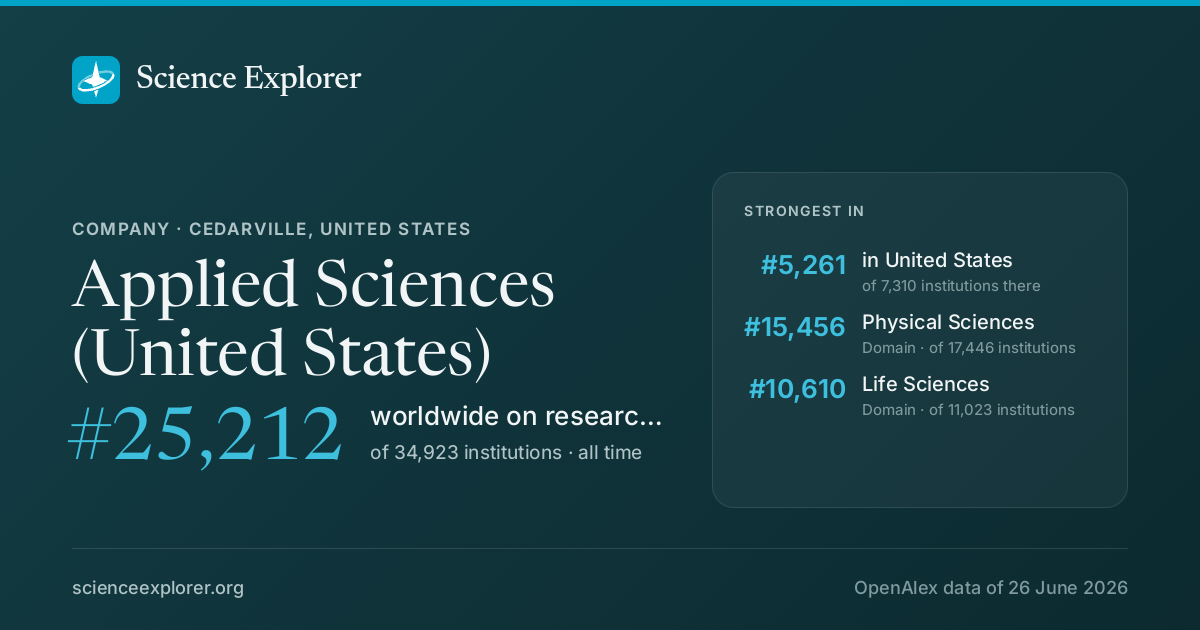
Applied Sciences (United States) on Science Explorer

A card with Applied Sciences (United States)'s standing and the fields it leads in, for a post or a slide. A link to this page previews as the same card.

Download the card

1200 × 630 PNG, sized for social posts, drawn from the latest snapshot.

Badges for a website1Each links back here and updates with every snapshot

Research measures only: rankings here say nothing about teaching, admissions or student experience. Comparable institutions and collaboration partners have tabs of their own, above.

Discussion

Ask a question or share a note about Applied Sciences (United States). Keep it to the research: no personal attacks, advertising or links. Any reader can report a post, which collapses it for everyone until it is opened.
