Science Explorer Back to mapMap
Discussion
Research facility · San Antonio · United States

Diagnostics Research Group

World rank, all time
#26,795
of 34,923
Rank in United States
#5,599
of 7,310
Research works
144
▼ 27% vs 2018-21
Citations
4k
27.7 per fractional work
Top-10% rate
18.1%
all institutions 10.0%
vs its own fields
1.13×
1.00× is exactly expected
Open access
21%
world 40%
International
31%
world 18%

Which fields of science does Diagnostics Research Group work in?

In 2022-now, 45% of research at Diagnostics Research Group is in Health Sciences, 31% in Physical Sciences. Its largest fields are Medicine (44%), Engineering (15%), Biochemistry, Genetics and Molecular Biology (14%). It does 1.6× the world's share of Health Sciences.

Health Sciences: 9 fractional works · 44.9% of its workMedicine: 9 fractional works · 44.0% of its workEpidemiology: 2 fractional works · 8.8% of its workOncology: 2 fractional works · 8.2% of its workSurgery: 1 fractional works · 6.6% of its workRadiology, Nuclear Medicine and Imaging: 1 fractional works · 5.4% of its workPulmonary and Respiratory Medicine: 1 fractional works · 4.7% of its workComplementary and alternative medicine: 0 fractional works · 2.1% of its workPathology and Forensic Medicine: 0 fractional works · 2.1% of its workPublic Health, Environmental and Occupational Health: 0 fractional works · 1.2% of its workEndocrinology, Diabetes and Metabolism: 0 fractional works · 0.8% of its workInfectious Diseases: 0 fractional works · 0.7% of its workGenetics: 0 fractional works · 0.6% of its workHealth Informatics: 0 fractional works · 0.5% of its workOrthopedics and Sports Medicine: 0 fractional works · 0.5% of its workPharmacology: 0 fractional works · 0.4% of its workCardiology and Cardiovascular Medicine: 0 fractional works · 0.3% of its workHematology: 0 fractional works · 0.2% of its workObstetrics and Gynecology: 0 fractional works · 0.2% of its workSmaller subfields together: 0 fractional works · 0.3% of its workVeterinary: 0 fractional works · 0.8% of its workSmall Animals: 0 fractional works · 0.8% of its workPhysical Sciences: 6 fractional works · 31.1% of its workEngineering: 3 fractional works · 14.6% of its workCivil and Structural Engineering: 1 fractional works · 4.0% of its workBiomedical Engineering: 1 fractional works · 3.6% of its workMedia Technology: 0 fractional works · 2.4% of its workSafety, Risk, Reliability and Quality: 0 fractional works · 2.1% of its workBuilding and Construction: 0 fractional works · 1.6% of its workMechanical Engineering: 0 fractional works · 0.8% of its workComputer Science: 1 fractional works · 5.3% of its workArtificial Intelligence: 0 fractional works · 1.6% of its workComputer Science Applications: 0 fractional works · 1.6% of its workInformation Systems: 0 fractional works · 1.6% of its workComputer Networks and Communications: 0 fractional works · 0.4% of its workSmaller subfields together: 0 fractional works · 0.0% of its workEnvironmental Science: 1 fractional works · 3.3% of its workHealth, Toxicology and Mutagenesis: 1 fractional works · 2.6% of its workGlobal and Planetary Change: 0 fractional works · 0.5% of its workSmaller subfields together: 0 fractional works · 0.1% of its workMathematics: 1 fractional works · 3.0% of its workModeling and Simulation: 0 fractional works · 2.4% of its workStatistics and Probability: 0 fractional works · 0.5% of its workChemistry: 0 fractional works · 2.4% of its workAnalytical Chemistry: 0 fractional works · 2.4% of its workEarth and Planetary Sciences: 0 fractional works · 1.2% of its workAtmospheric Science: 0 fractional works · 1.1% of its workSmaller subfields together: 0 fractional works · 0.1% of its workChemical Engineering: 0 fractional works · 0.8% of its workCatalysis: 0 fractional works · 0.8% of its workMaterials Science: 0 fractional works · 0.5% of its workMaterials Chemistry: 0 fractional works · 0.5% of its workLife Sciences: 4 fractional works · 21.6% of its workBiochemistry, Genetics and Molecular Biology: 3 fractional works · 13.6% of its workMolecular Biology: 1 fractional works · 4.3% of its workBiotechnology: 1 fractional works · 4.2% of its workCancer Research: 1 fractional works · 3.0% of its workGenetics: 0 fractional works · 1.2% of its workBiophysics: 0 fractional works · 0.8% of its workImmunology and Microbiology: 1 fractional works · 3.4% of its workImmunology: 1 fractional works · 3.2% of its workMicrobiology: 0 fractional works · 0.2% of its workNeuroscience: 0 fractional works · 2.0% of its workNeurology: 0 fractional works · 1.2% of its workCognitive Neuroscience: 0 fractional works · 0.8% of its workAgricultural and Biological Sciences: 0 fractional works · 1.6% of its workFood Science: 0 fractional works · 1.6% of its workPharmacology, Toxicology and Pharmaceutics: 0 fractional works · 0.9% of its workPharmaceutical Science: 0 fractional works · 0.8% of its workSmaller subfields together: 0 fractional works · 0.1% of its workSocial Sciences: 0 fractional works · 2.4% of its workBusiness, Management and Accounting: 0 fractional works · 1.6% of its workStrategy and Management: 0 fractional works · 1.6% of its workSocial Sciences: 0 fractional works · 0.8% of its workCommunication: 0 fractional works · 0.8% of its workALL ITS WORKDiagnosticsResearch Group20fractional works, 2022-now
Life Sciences22%Physical Sciences31%Health Sciences45%Social Sciences2%

Each ring splits the one inside it: the four domains of science, their fields, their subfields. Size is fractional works in 2022-now. Every slice is a page; the interactive view zooms down to single topics and colours each by how much more of it this institution does than the world.

Its 4 domains and 17 fields, with their numbers
    1. Medicine944.0%
    2. Veterinary00.8%
    1. Engineering314.6%
    2. Computer Science15.3%
    3. Environmental Science13.3%
    4. Mathematics13.0%
    5. Chemistry02.4%
    6. Earth and Planetary Sciences01.2%
    7. Chemical Engineering00.8%
    8. Materials Science00.5%
    1. Biochemistry, Genetics and Molecular Biology313.6%
    2. Immunology and Microbiology13.4%
    3. Neuroscience02.0%
    4. Agricultural and Biological Sciences01.6%
    5. Pharmacology, Toxicology and Pharmaceutics00.9%
    1. Business, Management and Accounting01.6%
    2. Social Sciences00.8%
All of science, and how each field's share has moved since 1950: the Science domain explorer

Field profile

Location quotient across every field it publishes in: outside the ring is more than an institution of this size would be expected to publish, inside it is less.

Agricultural and Biological Sciences: 0.34× its world share, 0 worksAgricultural and Bio…Biochemistry, Genetics and Molecular Biology: 2.54× its world share, 3 worksBiochemistry, Geneti…Immunology and Microbiology: 3.39× its world share, 1 worksImmunology and Micro…Neuroscience: 1.25× its world share, 0 worksNeurosciencePharmacology, Toxicology and Pharmaceutics: 2.56× its world share, 0 worksPharmacology, Toxico…Chemical Engineering: 2.33× its world share, 0 worksChemical EngineeringChemistry: 1.56× its world share, 0 worksChemistryComputer Science: 0.68× its world share, 1 worksComputer ScienceEarth and Planetary Sciences: 0.79× its world share, 0 worksEarth and Planetary …Engineering: 0.97× its world share, 3 worksEngineeringEnvironmental Science: 0.66× its world share, 1 worksEnvironmental ScienceMaterials Science: 0.16× its world share, 0 worksMaterials ScienceMathematics: 2.54× its world share, 1 worksMathematicsMedicine: 2.29× its world share, 9 worksMedicineVeterinary: 5.99× its world share, 0 worksVeterinaryBusiness, Management and Accounting: 0.50× its world share, 0 worksBusiness, Management…Social Sciences: 0.06× its world share, 0 worksSocial Sciences1×world share
more than its size predictsabout as predictedless

Rings at 0.5×, 1× and 2×. Widest outward: Veterinary, 6.0×. Every wedge is a field page.

All 17 fields, with their numbers
  1. Veterinary5.99×0 works
  2. Immunology and Microbiology3.39×1 works
  3. Pharmacology, Toxicology and Pharmaceutics2.56×0 works
  4. Biochemistry, Genetics and Molecular Biology2.54×3 works
  5. Mathematics2.54×1 works
  6. Chemical Engineering2.33×0 works
  7. Medicine2.29×9 works
  8. Chemistry1.56×0 works
  9. Neuroscience1.25×0 works
  10. Engineering0.97×3 works
  11. Earth and Planetary Sciences0.79×0 works
  12. Computer Science0.68×1 works
  13. Environmental Science0.66×1 works
  14. Business, Management and Accounting0.50×0 works
  15. Agricultural and Biological Sciences0.34×0 works
  16. Materials Science0.16×0 works
  17. Social Sciences0.06×0 works

Who are the top researchers at Diagnostics Research Group?

Ranked on the quality score, Charles P. Andrews and Donald R. Mehlisch lead among researchers whose main affiliation is Diagnostics Research Group.

  1. 1 Charles P. Andrews United States · #441,049 worldwide 3.3k citations · 96 works
  2. 2 Donald R. Mehlisch United States · #3,321,378 worldwide 1.3k citations · 55 works
All ranked researchers at Diagnostics Research Group

What are the most cited papers from Diagnostics Research Group?

The most cited paper from Diagnostics Research Group is "The Safety and Efficacy of Infliximab in Moderate to Severe Chronic Obstructive Pulmonary Disease" (Stephen I. Rennard et al., 2007), with 436 citations. Next come "The inverted pear glenoid: an indicator of significant glenoid bone loss" (432) and "Introduction to Digital Image Analysis in Whole-slide Imaging: A White Paper from the Digital Pathology Association" (413).

Most cited papers
#PaperReleasedCitations
1 The Safety and Efficacy of Infliximab in Moderate to Severe Chronic Obstructive Pulmonary Disease Stephen I. Rennard et al. · American Journal of Respiratory and Critical Care Medicine 8 Feb 2007 436
2 The inverted pear glenoid: an indicator of significant glenoid bone loss Ian K.Y. Lo, Peter M. Parten, Stephen S. Burkhart · Arthroscopy The Journal of Arthroscopic and Related Surgery Feb 2004 432
3 Introduction to Digital Image Analysis in Whole-slide Imaging: A White Paper from the Digital Pathology Association Famke Aeffner, Mark D. Zarella, Nathan Buchbinder et al. · Journal of Pathology Informatics Open access 2019 413
4 Double‐row arthroscopic rotator cuff repair: re‐establishing the footprint of the rotator cuff Ian K.Y. Lo, Stephen S. Burkhart · Arthroscopy The Journal of Arthroscopic and Related Surgery Nov 2003 369
5 The dynamic range of the human metabolome revealed by challenges Susanne M. Krug et al. · The FASEB Journal 16 Mar 2012 330
All 62 most cited papers, with filters and sorting

Which research topics does Diagnostics Research Group publish most on?

By volume in 2022-now: Cancer Research and Treatments, Gastrointestinal disorders and treatments, 3D Printing in Biomedical Research and Engineering Education and Curriculum Development.

  1. 1 Cancer Research and Treatments Biotechnology 1 works
  2. 2 Gastrointestinal disorders and treatments Surgery 1 works
  3. 3 3D Printing in Biomedical Research Biomedical Engineering 0 works
  4. 4 Engineering Education and Curriculum Development Media Technology 0 works
  5. 5 Mathematical Biology Tumor Growth Modeling and Simulation 0 works
  6. 6 Cervical Cancer and HPV Research Epidemiology 0 works
  7. 7 Global Cancer Incidence and Screening Oncology 0 works
  8. 8 Analytical chemistry methods development Analytical Chemistry 0 works
  9. 9 14-3-3 protein interactions Molecular Biology 0 works
  10. 10 Heavy Metal Exposure and Toxicity Health, Toxicology and Mutagenesis 0 works

How open and international is its research?

Against the world's own shares: the tick on each track. Both are shares of its output, so they sit on one scale and can be read against each other as well as against the world.

openly available21.4%not open78.6%

World: 40% of research is openly available.

with international co-authors31.3%domestic only68.7%

World: 18% is written across borders.

How has Diagnostics Research Group's research output changed?

Output in 2022-2025 was 27% lower than in 2018-2021.

still counting1990200020102020
grewheldshrank

The same series as a ribbon: one cell per year, darker for more. The line above answers how much; this answers when.

Its share of all research

Growing output can still be a shrinking share: all of science grows. This is Diagnostics Research Group as a percentage of every work published that year, 0.000086% in 2024.

still counting0.00050%0.0010%Diagnostics Research Group0.000085% in 202519801990200020102020

Fractional works of Diagnostics Research Group over all fractional works that year. How the balance of science has shifted.

Other research institutions in San Antonio

All research institutions in San Antonio

Share Diagnostics Research Group's ranking
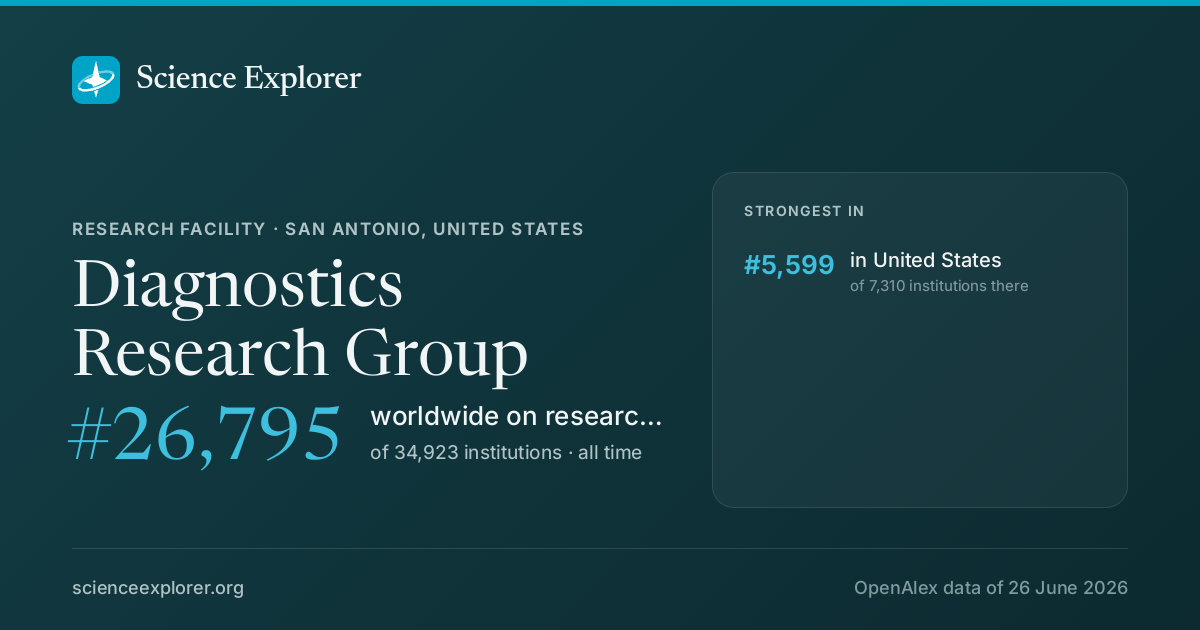
Diagnostics Research Group on Science Explorer

A card with Diagnostics Research Group's standing and the fields it leads in, for a post or a slide. A link to this page previews as the same card.

Download the card

1200 × 630 PNG, sized for social posts, drawn from the latest snapshot.

Badges for a website1Each links back here and updates with every snapshot

Research measures only: rankings here say nothing about teaching, admissions or student experience. Comparable institutions and collaboration partners have tabs of their own, above.

Discussion

Ask a question or share a note about Diagnostics Research Group. Posts are plain text and can be reported.