Kalinga University
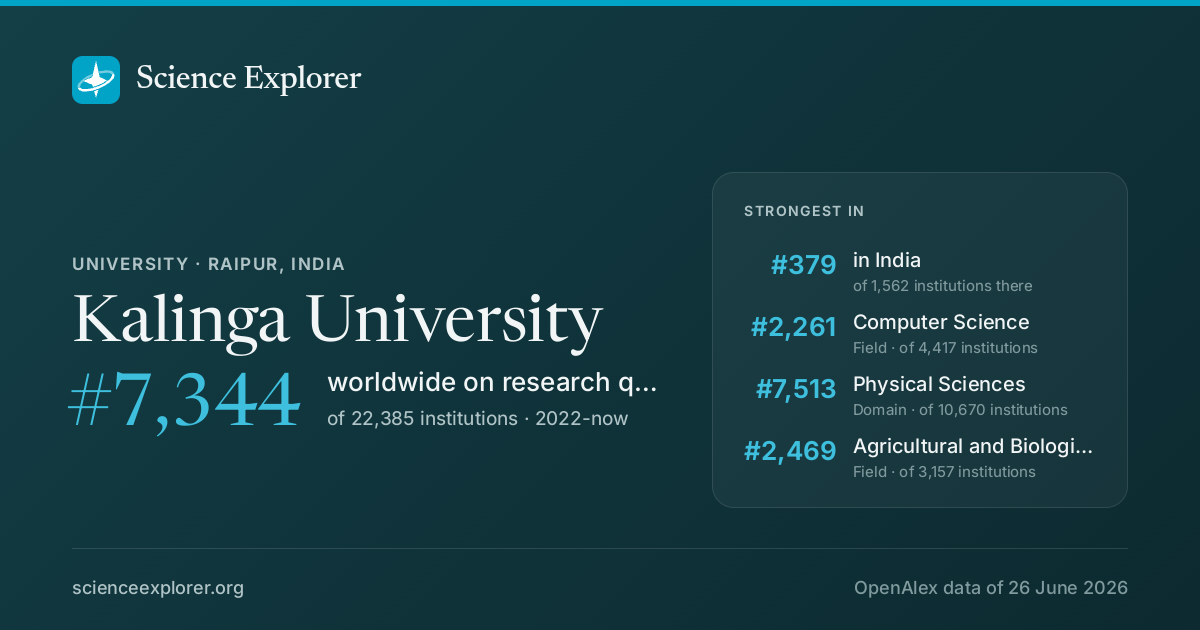
In research, Kalinga University stands highest in Computer Science (#2,261 of 4,417 worldwide), Physical Sciences (#7,513 of 10,670 worldwide) and Agricultural and Biological Sciences (#2,469 of 3,157 worldwide), 2022-now. Relative to its size it is most specialised in Health Information Management, Computer Networks and Communications and Management Information Systems (Health Information Management is 5.5× its share of world research).
- World rank, 2022-now
- #7,344 of 22,385 · #10,904 all time
- Rank in India
- #379 of 1,562
- Research works
- 2.2k ▲ 672% vs 2018-21
- Citations
- 2.5k 1.1 per fractional work
- Top-10% rate
- 2.6% all institutions 10.0%
- vs its own fields
- 0.47× 1.00× is exactly expected
- Open access
- 67% world 40%
- International
- 10% world 18%
What is Kalinga University known for in research?
The fields where it stands highest, 2022-now, ranked among every institution above the floor in each field.
| Field | World rank | Where that sits | Top-10% rate | Works | All time |
|---|---|---|---|---|---|
| Computer ScienceField | #2,261 of 4,417 | 2.2% | 299 | #3579 | |
| Physical SciencesDomain | #7,513 of 10,670 | 2.0% | 753 | #8803 | |
| Agricultural and Biological SciencesField | #2,469 of 3,157 | 2.5% | 96 | #4245 | |
| Life SciencesDomain | #5,042 of 6,403 | 2.5% | 181 | #7883 | |
| Computer Networks and CommunicationsSubfield | #629 of 728 | 1.7% | 67 | - | |
| EngineeringField | #5,111 of 5,901 | 2.0% | 268 | #8228 | |
| Social SciencesDomain | #8,362 of 9,585 | 2.5% | 392 | #12783 | |
| Information SystemsSubfield | #1,156 of 1,321 | 5.1% | 81 | #2153 | |
| Artificial IntelligenceSubfield | #1,630 of 1,862 | 1.2% | 79 | #2387 | |
| Business, Management and AccountingField | #2,330 of 2,581 | 1.9% | 102 | #3584 |
Each strip is that field's whole ranked pool, with the notch where Kalinga University sits in it, in the colour of the band that rank falls in. The track under the rate is the rate itself: it carries no average mark, because the average differs by field (from about 6% in Dentistry to 21% in Economics).
Which of those standings moved
The same fields on both windows: where it stood over the whole record, and where it stands in 2022-now. The distance is the story, and it is the one thing the two rank columns above cannot show.
- Computer Science#3,579 #2,261
- Physical Sciences#8,803 #7,513
- Agricultural and Biological Sciences#4,245 #2,469
- Life Sciences#7,883 #5,042
- Engineering#8,228 #5,111
- Social Sciences#12,783 #8,362
- Information Systems#2,153 #1,156
- Artificial Intelligence#2,387 #1,630
- Business, Management and Accounting#3,584 #2,330
A dot further right is a better standing. Fields it was not ranked in over the whole record are left out.
Which fields of science does Kalinga University work in?
In 2022-now, 52% of research at Kalinga University is in Physical Sciences, 26% in Social Sciences. Its largest fields are Computer Science (23%), Engineering (16%), Social Sciences (9%). It does 1.3× the world's share of Physical Sciences.
Each ring splits the one inside it: the four domains of science, their fields, their subfields. Size is fractional works in 2022-now. Every slice is a page; the interactive view zooms down to single topics and colours each by how much more of it this institution does than the world.
Its 4 domains and 26 fields, with their numbers
- Physical Sciences1,01751.6%
- Computer Science45523.1%
- Engineering32416.5%
- Environmental Science1155.8%
- Materials Science432.2%
- Chemistry281.4%
- Energy170.9%
- Mathematics120.6%
- Physics and Astronomy110.6%
- Earth and Planetary Sciences80.4%
- Chemical Engineering20.1%
- Social Sciences51326.0%
- Social Sciences1819.2%
- Business, Management and Accounting1226.2%
- Psychology653.3%
- Economics, Econometrics and Finance582.9%
- Arts and Humanities462.3%
- Decision Sciences412.1%
- Health Sciences22011.2%
- Medicine1467.4%
- Health Professions643.3%
- Nursing60.3%
- Dentistry30.1%
- Veterinary10.1%
- Life Sciences21911.1%
What does Kalinga University specialise in?
Where its research is concentrated relative to its size: Health Information Management takes 5.5× the share of its output that it takes of world research.
- Health Information ManagementSubfield · 28.0 works5.5×
- Computer Networks and CommunicationsSubfield · 96.3 works5.5×
- Management Information SystemsSubfield · 31.6 works3.9×
Location quotient, a volume reading rather than an impact one. It surfaces small, lopsided specialities.
Field profile
Location quotient across every field it publishes in: outside the ring is more than an institution of this size would be expected to publish, inside it is less.
Rings at 0.5×, 1× and 2×. Widest outward: Computer Science, 3.0×. Every wedge is a field page.
All 26 fields, with their numbers
- Computer Science2.97×455 works
- Pharmacology, Toxicology and Pharmaceutics2.16×15 works
- Decision Sciences2.14×41 works
- Business, Management and Accounting1.93×122 works
- Economics, Econometrics and Finance1.38×58 works
- Health Professions1.23×64 works
- Agricultural and Biological Sciences1.17×109 works
- Environmental Science1.17×115 works
- Engineering1.10×324 works
- Psychology1.09×65 works
- Energy0.96×17 works
- Chemistry0.92×28 works
- Neuroscience0.87×28 works
- Arts and Humanities0.81×46 works
- Social Sciences0.72×180 works
- Materials Science0.63×43 works
- Nursing0.61×6 works
- Biochemistry, Genetics and Molecular Biology0.57×60 works
- Mathematics0.51×12 works
- Medicine0.39×146 works
- Immunology and Microbiology0.37×7 works
- Veterinary0.37×1 works
- Chemical Engineering0.31×2 works
- Dentistry0.30×3 works
- Earth and Planetary Sciences0.27×8 works
- Physics and Astronomy0.26×11 works
- Computer Science 3.0×
- Pharmacology, Toxicology and Pharmaceutics 2.2×
- Decision Sciences 2.1×
- Business, Management and Accounting 1.9×
- Economics, Econometrics and Finance 1.4×
- Health Professions 1.2×
- Agricultural and Biological Sciences 1.2×
- Environmental Science 1.2×
- Engineering 1.1×
- Psychology 1.1×
- Energy 1.0×
- Chemistry 0.9×
- Neuroscience 0.9×
- Arts and Humanities 0.8×
- Social Sciences 0.7×
- Materials Science 0.6×
- Nursing 0.6×
- Biochemistry, Genetics and Molecular Biology 0.6×
- Mathematics 0.5×
- Medicine 0.4×
- Immunology and Microbiology 0.4×
- Veterinary 0.4×
- Chemical Engineering 0.3×
- Dentistry 0.3×
- Earth and Planetary Sciences 0.3×
- Physics and Astronomy 0.3×
Who are the top researchers at Kalinga University?
Ranked on the quality score, Suman Kumar Swarnkar, Omprakash Dewangan and Aparna Atul Junnarkar lead among researchers whose main affiliation is Kalinga University.
- 1
Suman Kumar Swarnkar
 India · #2,009,447 worldwide
488 citations · 60 works
- 2
Omprakash Dewangan
India · #2,765,833 worldwide
141 citations · 35 works
- 3
Aparna Atul Junnarkar
India · #2,800,189 worldwide
642 citations · 62 works
- 4
Paromita Banerjee
India · #2,802,606 worldwide
618 citations · 43 works
- 5
Deipali Vikram Gore
India · #3,226,474 worldwide
123 citations · 17 works
- 6
Manoj Pratap Singh
India · #3,391,003 worldwide
745 citations · 41 works
- 7
P. Saravana Kumar
India · #3,434,301 worldwide
143 citations · 17 works
- 8
Shraddha Verma
India · #3,949,763 worldwide
252 citations · 62 works
- 9
Fahrurrozi Rahman
India · #3,960,956 worldwide
57 citations · 26 works
- 10
Anjum Nazir Qureshi Sheikh
India · #4,036,748 worldwide
42 citations · 20 works
Which keywords describe research at Kalinga University?
By fractional works in 2022-now, weighted toward what it does more of than the world: Machine Learning, Deep Learning, Internet of Things, Healthcare, Security, Wireless Sensor Networks, Data Mining and Big Data.
- Network Security
- Mobile Edge Computing
- Classification Models
- Edge Computing
- Cyber-Physical Systems
- Crop Yield Prediction
- Smart Farming
- Smart Grid
- Privacy
- Cloud Computing
- Convolutional Neural Networks
- IoT
- IoT Security
- Cybersecurity
- Renewable Energy
- Sustainability
- Neural Networks
- Security
- Internet of Things
- Deep Learning
- Machine Learning
- Healthcare
- Artificial Intelligence
- Big Data
- Data Mining
- Wireless Sensor Networks
- Environmental Monitoring
- Supply Chain Management
- Smart Cities
- Big Data Analytics
- Image Processing
- Anomaly Detection
- Feature Selection
- Internet of Things (IoT)
- Security and Privacy
- Plant Disease Detection
- 5G Networks
- Intrusion Detection
- Medical Diagnosis
- Fog Computing
Size is fractional works in 2022-now in the topics tagged with each word; colour is the word's share of this institution's work against its share of the world's. The 40 words are chosen for being large and distinctive. Each links to the topic it comes from most.
All 40 words, with their numbers
- Machine Learning300▲ 4.6×81 topics
- Deep Learning255▲ 3.8×77 topics
- Healthcare103▲ 4.6×11 topics
- Internet of Things99▲ 5.8×21 topics
- Artificial Intelligence85▲ 3.0×44 topics
- Security84▲ 6.4×21 topics
- Big Data81▲ 4.3×26 topics
- Neural Networks81▲ 2.7×34 topics
- Data Mining76▲ 5.3×16 topics
- Sustainability72▲ 1.51×56 topics
- Wireless Sensor Networks68▲ 7.7×17 topics
- Renewable Energy56▲ 1.96×38 topics
- Environmental Monitoring55▲ 7.2×14 topics
- Cybersecurity53▲ 11×5 topics
- Supply Chain Management53▲ 3.0×14 topics
- IoT Security52▲ 8.6×3 topics
- Smart Cities50▲ 9.5×8 topics
- IoT46▲ 6.2×16 topics
- Big Data Analytics44▲ 11×4 topics
- Convolutional Neural Networks44▲ 3.0×14 topics
- Image Processing40▲ 4.7×9 topics
- Cloud Computing39▲ 6.9×12 topics
- Anomaly Detection37▲ 6.5×5 topics
- Privacy36▲ 6.3×6 topics
- Feature Selection33▲ 7.9×6 topics
- Smart Grid33▲ 4.7×10 topics
- Internet of Things (IoT)32▲ 14×2 topics
- Smart Farming32▲ 14×2 topics
- Security and Privacy31▲ 8.4×3 topics
- Crop Yield Prediction30▲ 15×1 topic
- Plant Disease Detection30▲ 15×1 topic
- Cyber-Physical Systems29▲ 5.6×8 topics
- 5G Networks29▲ 7.3×4 topics
- Edge Computing29▲ 11×2 topics
- Intrusion Detection28▲ 9.8×4 topics
- Classification Models27▲ 16×1 topic
- Medical Diagnosis27▲ 15×1 topic
- Mobile Edge Computing26▲ 8.2×2 topics
- Fog Computing24▲ 11×2 topics
- Network Security22▲ 8.6×2 topics
Which research topics does Kalinga University publish most on?
By volume in 2022-now: Smart Agriculture and AI, Artificial Intelligence in Healthcare, IoT and Edge/Fog Computing and Network Security and Intrusion Detection.
Area is fractional works; colour is the subfield each topic belongs to.
- 1 Smart Agriculture and AI Plant Science 30 works
- 2 Artificial Intelligence in Healthcare Health Information Management 27 works
- 3 IoT and Edge/Fog Computing Computer Networks and Communications 24 works
- 4 Network Security and Intrusion Detection Computer Networks and Communications 21 works
- 5 Blockchain Technology Applications and Security Information Systems 18 works
- 6 Healthcare Systems and Reforms Finance 14 works
- 7 Microgrid Control and Optimization Control and Systems Engineering 12 works
- 8 Brain Tumor Detection and Classification Neurology 11 works
- 9 Internet of Things and AI Information Systems 11 works
- 10 Big Data and Digital Economy Information Systems 11 works
How open and international is its research?
Against the world's own shares: the tick on each track. Both are shares of its output, so they sit on one scale and can be read against each other as well as against the world.
World: 40% of research is openly available.
World: 18% is written across borders.
How has Kalinga University's research output changed?
Output in 2022-2025 was 672% higher than in 2018-2021.
The same series as a ribbon: one cell per year, darker for more. The line above answers how much; this answers when.
Its share of all research
Growing output can still be a shrinking share: all of science grows. This is Kalinga University as a percentage of every work published that year, 0.0094% in 2024.
Fractional works of Kalinga University over all fractional works that year. How the balance of science has shifted.
How much of it reaches the world top 10%
Year by year, against all institutions in the same year.
Of each year's output, the share that reached the world's 10% most cited for its field and year. Peak 3.2% in 2023.
Other research institutions in Raipur
- National Institute of Technology Raipur
- Pandit Ravishankar Shukla University
- Indira Gandhi Agricultural University
- Pt. Jawahar Lal Nehru Memorial Medical College
- Chhattisgarh Kamdhenu Vishwavidyalaya
- Mahaveer Academy of Technology and Science University
- Indian Institute of Management Raipur
- Sickle Cell Institute Chhattisgarh, Raipur
Share Kalinga University's ranking
Badges for a website1Each links back here and updates with every snapshot

Research measures only: rankings here say nothing about teaching, admissions or student experience. Comparable institutions and collaboration partners have tabs of their own, above.
Discussion
Ask a question or share a note about Kalinga University. Posts are plain text and can be reported.