Sullivan University
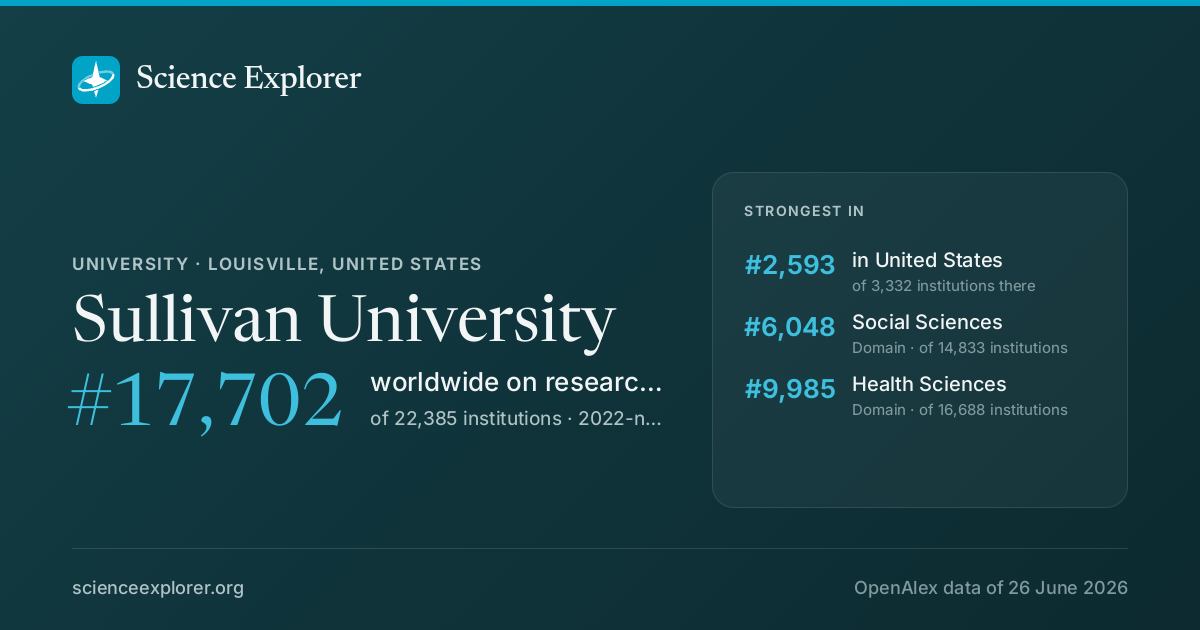
In research, Sullivan University stands highest in Social Sciences (#6,048 of 14,833 worldwide) and Health Sciences (#9,985 of 16,688 worldwide), over all time.
- World rank, 2022-now
- #17,702 of 22,385 · #12,065 all time
- Rank in United States
- #2,593 of 3,332
- Research works
- 471 ▼ 35% vs 2018-21
- Citations
- 5.6k 11.9 per fractional work
- Top-10% rate
- 8.5% all institutions 10.0%
- vs its own fields
- 1.02× 1.00× is exactly expected
- Open access
- 42% world 40%
- International
- 15% world 18%
What is Sullivan University known for in research?
The fields where it stands highest, over all time, ranked among every institution above the floor in each field.
| Field | World rank | Where that sits | Top-10% rate | Works |
|---|---|---|---|---|
| Social SciencesDomain | #6,048 of 14,833 | 7.8% | 210 | |
| Health SciencesDomain | #9,985 of 16,688 | 8.2% | 144 |
Each strip is that field's whole ranked pool, with the notch where Sullivan University sits in it, in the colour of the band that rank falls in. The track under the rate is the rate itself: it carries no average mark, because the average differs by field (from about 6% in Dentistry to 21% in Economics).
Which fields of science does Sullivan University work in?
In 2022-now, 43% of research at Sullivan University is in Social Sciences, 36% in Health Sciences. Its largest fields are Medicine (26%), Social Sciences (15%), Business, Management and Accounting (13%). It does 1.6× the world's share of Social Sciences.
Each ring splits the one inside it: the four domains of science, their fields, their subfields. Size is fractional works in 2022-now. Every slice is a page; the interactive view zooms down to single topics and colours each by how much more of it this institution does than the world.
Its 4 domains and 21 fields, with their numbers
- Social Sciences2943.0%
- Social Sciences1014.6%
- Business, Management and Accounting913.4%
- Psychology45.2%
- Economics, Econometrics and Finance34.2%
- Arts and Humanities23.0%
- Decision Sciences22.6%
- Health Sciences2536.3%
- Medicine1825.7%
- Health Professions68.6%
- Nursing11.6%
- Dentistry00.4%
- Physical Sciences913.6%
- Computer Science68.8%
- Environmental Science11.6%
- Mathematics11.2%
- Chemistry11.0%
- Engineering00.6%
- Materials Science00.5%
- Life Sciences57.0%
Field profile
Location quotient across every field it publishes in: outside the ring is more than an institution of this size would be expected to publish, inside it is less.
Rings at 0.5×, 1× and 2×. Widest outward: Pharmacology, Toxicology and Pharmaceutics, 6.0×. Every wedge is a field page.
All 21 fields, with their numbers
- Pharmacology, Toxicology and Pharmaceutics6.00×1 works
- Business, Management and Accounting4.15×9 works
- Health Professions3.28×6 works
- Nursing3.17×1 works
- Decision Sciences2.70×2 works
- Economics, Econometrics and Finance1.96×3 works
- Psychology1.72×4 works
- Medicine1.34×18 works
- Social Sciences1.16×10 works
- Computer Science1.13×6 works
- Immunology and Microbiology1.08×1 works
- Mathematics1.04×1 works
- Arts and Humanities1.03×2 works
- Dentistry0.79×0 works
- Chemistry0.62×1 works
- Biochemistry, Genetics and Molecular Biology0.37×1 works
- Environmental Science0.32×1 works
- Agricultural and Biological Sciences0.31×1 works
- Neuroscience0.24×0 works
- Materials Science0.13×0 works
- Engineering0.04×0 works
- Pharmacology, Toxicology and Pharmaceutics 6.0×
- Business, Management and Accounting 4.2×
- Health Professions 3.3×
- Nursing 3.2×
- Decision Sciences 2.7×
- Economics, Econometrics and Finance 2.0×
- Psychology 1.7×
- Medicine 1.3×
- Social Sciences 1.2×
- Computer Science 1.1×
- Immunology and Microbiology 1.1×
- Mathematics 1.0×
- Arts and Humanities 1.0×
- Dentistry 0.8×
- Chemistry 0.6×
- Biochemistry, Genetics and Molecular Biology 0.4×
- Environmental Science 0.3×
- Agricultural and Biological Sciences 0.3×
- Neuroscience 0.2×
- Materials Science 0.1×
- Engineering 0.0×
Who are the top researchers at Sullivan University?
Ranked on the quality score, Kimberly K. Daugherty, Daniel R. Malcom and Anthony A. Piña lead among researchers whose main affiliation is Sullivan University.
- 1
Kimberly K. Daugherty
 United States · #1,285,740 worldwide
820 citations · 86 works
- 2
Daniel R. Malcom
United States · #1,711,677 worldwide
961 citations · 59 works
- 3
Anthony A. Piña
United States · #2,996,280 worldwide
278 citations · 37 works
- 4
Steve Hart
United States · #3,316,805 worldwide
38 citations · 20 works
- 5
Katie F. Leslie
United States · #3,628,498 worldwide
202 citations · 31 works
- 6
Wasana K. Sumanasekera
United States · #3,802,675 worldwide
700 citations · 31 works
- 7
Emmanuel Udoh
United States · #3,814,792 worldwide
134 citations · 39 works
- 8
Teresa Ann Daniel
United States · #3,882,668 worldwide
176 citations · 41 works
- 9
Emma Palmer
United States · #3,990,009 worldwide
381 citations · 24 works
- 10
Miriam Delmondes Batista
United States · #4,078,134 worldwide
9 citations · 20 works
Which keywords describe research at Sullivan University?
By fractional works in 2022-now, weighted toward what it does more of than the world: Reflective Practice, Assessment Methods, Competency-Based Education, Faculty Development, Continuing Medical Education, Professional Identity Formation, Supply Chain Management and Social Capital.
- Evidence-Based Practice
- Patient Safety
- Adverse Drug Reactions
- Type 2 Diabetes
- MapReduce
- Gender Bias
- Clinical Practice
- Psychological Distress
- Work-Life Balance
- Medical Education
- Lean Manufacturing
- Collaborative Relationships
- Student Engagement
- Cloud Computing
- Mental Health
- Big Data
- Social Capital
- Professional Identity Formation
- Faculty Development
- Assessment Methods
- Reflective Practice
- Competency-Based Education
- Continuing Medical Education
- Supply Chain Management
- Job Satisfaction
- Inappropriate Medication Use
- Polypharmacy
- Performance Measurement
- Depression
- Energy Efficiency
- Anxiety
- Teaching Strategies
- Active Learning
- Burnout
- Educational Strategies
- Health Outcomes
- Mentorship
- Virtualization
- Cross-Cultural Communication
- Strategic Alliances
Size is fractional works in 2022-now in the topics tagged with each word; colour is the word's share of this institution's work against its share of the world's. The 40 words are chosen for being large and distinctive. Each links to the topic it comes from most.
All 40 words, with their numbers
- Reflective Practice6▲ 46×4 topics
- Assessment Methods6▲ 76×2 topics
- Competency-Based Education5▲ 85×2 topics
- Faculty Development5▲ 96×2 topics
- Continuing Medical Education5▲ 114×1 topic
- Professional Identity Formation5▲ 114×1 topic
- Supply Chain Management4▲ 5.7×4 topics
- Social Capital3▲ 7.8×6 topics
- Job Satisfaction3▲ 9.1×7 topics
- Big Data3▲ 4.0×4 topics
- Inappropriate Medication Use2▲ 84×1 topic
- Mental Health2▲ 2.5×11 topics
- Polypharmacy2▲ 84×1 topic
- Cloud Computing2▲ 12×3 topics
- Performance Measurement2▲ 12×2 topics
- Student Engagement2▲ 7.4×5 topics
- Depression2▲ 3.1×6 topics
- Collaborative Relationships2▲ 60×1 topic
- Energy Efficiency2▲ 2.9×3 topics
- Lean Manufacturing2▲ 15×1 topic
- Anxiety2▲ 5.1×4 topics
- Medical Education2▲ 8.0×4 topics
- Teaching Strategies2▲ 8.1×3 topics
- Work-Life Balance2▲ 11×3 topics
- Active Learning1▲ 12×2 topics
- Psychological Distress1▲ 8.1×2 topics
- Burnout1▲ 21×4 topics
- Clinical Practice1▲ 12×3 topics
- Educational Strategies1▲ 44×2 topics
- Gender Bias1▲ 21×2 topics
- Health Outcomes1▲ 7.3×6 topics
- MapReduce1▲ 33×1 topic
- Mentorship1▲ 48×2 topics
- Type 2 Diabetes1▲ 8.5×3 topics
- Virtualization1▲ 24×1 topic
- Adverse Drug Reactions1▲ 32×2 topics
- Cross-Cultural Communication1▲ 20×2 topics
- Patient Safety1▲ 11×3 topics
- Strategic Alliances1▲ 26×2 topics
- Evidence-Based Practice1▲ 13×4 topics
Which research topics does Sullivan University publish most on?
By volume in 2022-now: Innovations in Medical Education, Pharmaceutical Practices and Patient Outcomes, Quality and Supply Management and Cloud Computing and Resource Management.
Area is fractional works; colour is the subfield each topic belongs to.
- 1 Innovations in Medical Education Public Health, Environmental and Occupational Health 5 works
- 2 Pharmaceutical Practices and Patient Outcomes Geriatrics and Gerontology 2 works
- 3 Quality and Supply Management Management Information Systems 2 works
- 4 Cloud Computing and Resource Management Information Systems 1 works
- 5 Pharmacy and Medical Practices Pharmacology 1 works
- 6 Academic Writing and Publishing History and Philosophy of Science 1 works
- 7 Translation Studies and Practices Language and Linguistics 1 works
- 8 COVID-19 and Mental Health Clinical Psychology 1 works
- 9 Nursing education and management Research and Theory 1 works
- 10 Outsourcing and Supply Chain Management Management Information Systems 1 works
How open and international is its research?
Against the world's own shares: the tick on each track. Both are shares of its output, so they sit on one scale and can be read against each other as well as against the world.
World: 40% of research is openly available.
World: 18% is written across borders.
How has Sullivan University's research output changed?
Output in 2022-2025 was 35% lower than in 2018-2021.
The same series as a ribbon: one cell per year, darker for more. The line above answers how much; this answers when.
Its share of all research
Growing output can still be a shrinking share: all of science grows. This is Sullivan University as a percentage of every work published that year, 0.00031% in 2024.
Fractional works of Sullivan University over all fractional works that year. How the balance of science has shifted.
Other research institutions in Louisville
- University of Louisville
- Jewish Hospital
- Norton Healthcare
- Bellarmine University
- James Graham Brown Foundation
- Louisville Presbyterian Theological Seminary
- Community Living
- Kentucky Science Center

Share Sullivan University's ranking
Badges for a website1Each links back here and updates with every snapshot

Research measures only: rankings here say nothing about teaching, admissions or student experience. Comparable institutions and collaboration partners have tabs of their own, above.
Discussion
Ask a question or share a note about Sullivan University. Posts are plain text and can be reported.