Creative Technologies (United States)
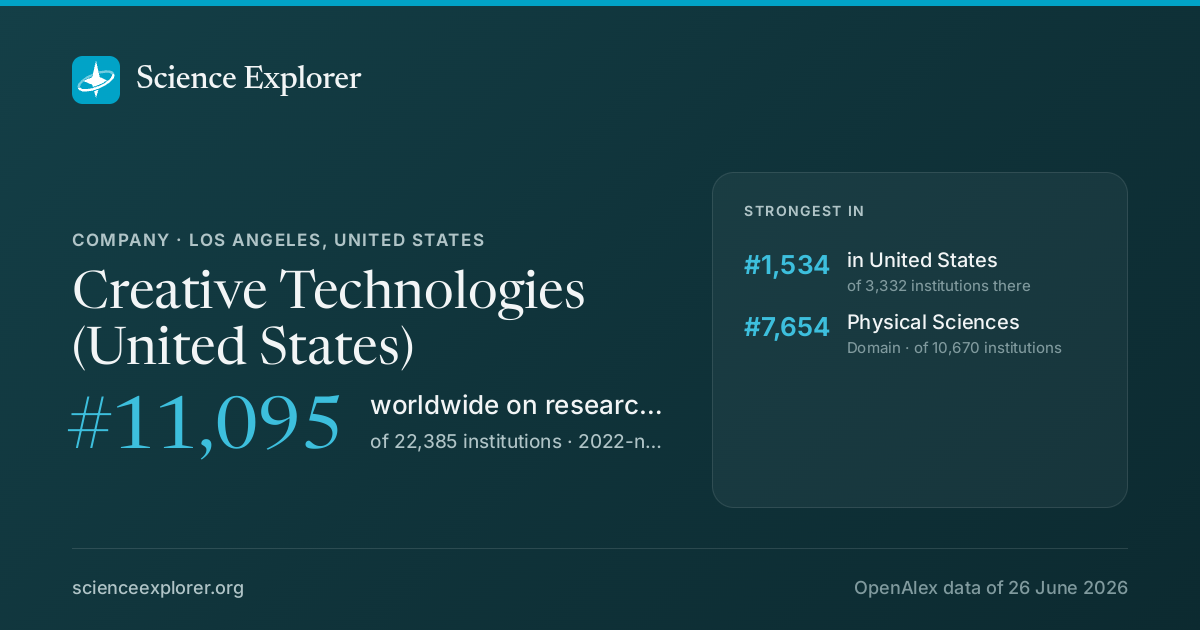
In research, Creative Technologies (United States) stands highest in Physical Sciences (#7,654 of 10,670 worldwide), 2022-now. Relative to its size it is most specialised in Artificial Intelligence (Artificial Intelligence is 6.0× its share of world research).
- World rank, 2022-now
- #11,095 of 22,385 · #6,229 all time
- Rank in United States
- #1,534 of 3,332
- Research works
- 678 ▲ 24% vs 2018-21
- Citations
- 23k 33.8 per fractional work
- Top-10% rate
- 15.7% all institutions 10.0%
- vs its own fields
- 1.11× 1.00× is exactly expected
- Open access
- 29% world 40%
- International
- 23% world 18%
What is Creative Technologies (United States) known for in research?
The fields where it stands highest, 2022-now, ranked among every institution above the floor in each field.
| Field | World rank | Where that sits | Top-10% rate | Works | All time |
|---|---|---|---|---|---|
| Physical SciencesDomain | #7,654 of 10,670 | 16.3% | 60 | #3923 |
Each strip is that field's whole ranked pool, with the notch where Creative Technologies (United States) sits in it, in the colour of the band that rank falls in. The track under the rate is the rate itself: it carries no average mark, because the average differs by field (from about 6% in Dentistry to 21% in Economics).
Which fields of science does Creative Technologies (United States) work in?
In 2022-now, 48% of research at Creative Technologies (United States) is in Physical Sciences, 37% in Social Sciences. Its largest fields are Computer Science (32%), Psychology (15%), Social Sciences (13%). It does 1.5× the world's share of Social Sciences.
Each ring splits the one inside it: the four domains of science, their fields, their subfields. Size is fractional works in 2022-now. Every slice is a page; the interactive view zooms down to single topics and colours each by how much more of it this institution does than the world.
Its 4 domains and 22 fields, with their numbers
- Physical Sciences7547.8%
- Computer Science5132.5%
- Engineering1610.5%
- Environmental Science42.6%
- Earth and Planetary Sciences21.0%
- Physics and Astronomy10.4%
- Mathematics10.4%
- Chemistry10.4%
- Materials Science00.1%
- Social Sciences5736.8%
- Psychology2314.6%
- Social Sciences2012.6%
- Arts and Humanities64.1%
- Business, Management and Accounting32.2%
- Decision Sciences31.6%
- Economics, Econometrics and Finance21.6%
- Health Sciences138.6%
- Medicine85.2%
- Health Professions53.4%
- Nursing00.1%
- Life Sciences116.8%
What does Creative Technologies (United States) specialise in?
Where its research is concentrated relative to its size: Artificial Intelligence takes 6.0× the share of its output that it takes of world research.
- Artificial IntelligenceSubfield · 22.6 works6.0×
Location quotient, a volume reading rather than an impact one. It surfaces small, lopsided specialities.
Field profile
Location quotient across every field it publishes in: outside the ring is more than an institution of this size would be expected to publish, inside it is less.
Rings at 0.5×, 1× and 2×. Widest outward: Psychology, 4.8×. Every wedge is a field page.
All 22 fields, with their numbers
- Psychology4.80×23 works
- Computer Science4.18×51 works
- Neuroscience2.65×7 works
- Decision Sciences1.66×2 works
- Arts and Humanities1.41×6 works
- Health Professions1.27×5 works
- Social Sciences1.00×20 works
- Economics, Econometrics and Finance0.74×2 works
- Pharmacology, Toxicology and Pharmaceutics0.71×0 works
- Engineering0.70×16 works
- Business, Management and Accounting0.69×4 works
- Earth and Planetary Sciences0.61×2 works
- Environmental Science0.53×4 works
- Mathematics0.32×1 works
- Biochemistry, Genetics and Molecular Biology0.30×2 works
- Medicine0.27×8 works
- Chemistry0.23×1 works
- Immunology and Microbiology0.20×0 works
- Physics and Astronomy0.18×1 works
- Nursing0.15×0 works
- Agricultural and Biological Sciences0.09×1 works
- Materials Science0.03×0 works
- Psychology 4.8×
- Computer Science 4.2×
- Neuroscience 2.6×
- Decision Sciences 1.7×
- Arts and Humanities 1.4×
- Health Professions 1.3×
- Social Sciences 1.0×
- Economics, Econometrics and Finance 0.7×
- Pharmacology, Toxicology and Pharmaceutics 0.7×
- Engineering 0.7×
- Business, Management and Accounting 0.7×
- Earth and Planetary Sciences 0.6×
- Environmental Science 0.5×
- Mathematics 0.3×
- Biochemistry, Genetics and Molecular Biology 0.3×
- Medicine 0.3×
- Chemistry 0.2×
- Immunology and Microbiology 0.2×
- Physics and Astronomy 0.2×
- Nursing 0.1×
- Agricultural and Biological Sciences 0.1×
- Materials Science 0.0×
Who are the top researchers at Creative Technologies (United States)?
Ranked on the quality score, Paul E. Debevec, Koki Nagano and Graham Fyffe lead among researchers whose main affiliation is Creative Technologies (United States).
- 1
Paul E. Debevec
 United States · #94,795 worldwide
20k citations · 295 works
- 2
Koki Nagano
United States · #175,443 worldwide
3.6k citations · 92 works
- 3
Graham Fyffe
United States · #280,210 worldwide
3.3k citations · 53 works
- 4
Jay Busch
United States · #385,733 worldwide
2.1k citations · 48 works
- 5
Ari Daniel Shapiro
United States · #484,788 worldwide
2.9k citations · 112 works
- 6
Evan A. Suma
United States · #499,173 worldwide
3.6k citations · 85 works
- 7
Mark T. Bolas
United States · #720,802 worldwide
5k citations · 164 works
- 8
Xueming Yu
United States · #795,265 worldwide
1.5k citations · 34 works
- 9
Oleg Alexander
United States · #858,211 worldwide
809 citations · 27 works
- 10
Yuyu Xu
United States · #1,061,029 worldwide
1.1k citations · 25 works
Which keywords describe research at Creative Technologies (United States)?
By fractional works in 2022-now, weighted toward what it does more of than the world: Deep Learning, Machine Learning, Artificial Intelligence, Big Data, Neural Networks, Feature Extraction, Human-Computer Interaction and Social Interaction.
- Deep Neural Networks
- Markov Decision Processes
- Algorithmic Bias
- Text Classification
- Transparency
- Topic Modeling
- Embodiment
- Fairness
- Natural Language Processing
- Discrimination
- Pose Estimation
- Reinforcement Learning
- Facial Expression
- Simulation
- Healthcare
- Convolutional Neural Networks
- Social Interaction
- Feature Extraction
- Neural Networks
- Machine Learning
- Deep Learning
- Artificial Intelligence
- Big Data
- Human-Computer Interaction
- Emotion Recognition
- Ethics
- Agent-Based Modeling
- Surveillance
- Multimodal Data
- Virtual Reality
- Multi-Agent Systems
- Emotion
- Trust
- Learning Outcomes
- Social Cognition
- Negotiation
- Human-Robot Interaction
- Accountability
- Information Retrieval
- Spoken Dialogue Systems
Size is fractional works in 2022-now in the topics tagged with each word; colour is the word's share of this institution's work against its share of the world's. The 40 words are chosen for being large and distinctive. Each links to the topic it comes from most.
All 40 words, with their numbers
- Deep Learning26▲ 4.8×48 topics
- Machine Learning19▲ 3.6×44 topics
- Artificial Intelligence12▲ 5.3×16 topics
- Neural Networks10▲ 4.4×23 topics
- Big Data10▲ 6.5×17 topics
- Feature Extraction6▲ 8.1×6 topics
- Human-Computer Interaction6▲ 20×3 topics
- Social Interaction6▲ 9.1×5 topics
- Emotion Recognition6▲ 18×3 topics
- Convolutional Neural Networks5▲ 4.6×9 topics
- Ethics5▲ 5.8×4 topics
- Healthcare5▲ 2.6×11 topics
- Agent-Based Modeling4▲ 20×5 topics
- Simulation4▲ 10×4 topics
- Surveillance4▲ 9.6×3 topics
- Facial Expression4▲ 58×1 topic
- Multimodal Data4▲ 58×1 topic
- Reinforcement Learning4▲ 22×3 topics
- Virtual Reality4▲ 5.1×4 topics
- Pose Estimation4▲ 21×2 topics
- Multi-Agent Systems4▲ 12×2 topics
- Discrimination3▲ 10×2 topics
- Emotion3▲ 10×7 topics
- Natural Language Processing3▲ 9.2×6 topics
- Trust3▲ 7.9×5 topics
- Fairness3▲ 20×2 topics
- Learning Outcomes3▲ 5.0×4 topics
- Embodiment3▲ 11×3 topics
- Social Cognition3▲ 11×7 topics
- Topic Modeling3▲ 13×2 topics
- Negotiation3▲ 55×2 topics
- Transparency3▲ 13×2 topics
- Human-Robot Interaction3▲ 15×3 topics
- Text Classification3▲ 11×3 topics
- Accountability3▲ 14×1 topic
- Algorithmic Bias3▲ 21×1 topic
- Information Retrieval3▲ 7.8×3 topics
- Markov Decision Processes2▲ 73×1 topic
- Spoken Dialogue Systems2▲ 73×1 topic
- Deep Neural Networks2▲ 13×3 topics
Which research topics does Creative Technologies (United States) publish most on?
By volume in 2022-now: Emotion and Mood Recognition, Ethics and Social Impacts of AI, Speech and dialogue systems and Topic Modeling.
Area is fractional works; colour is the subfield each topic belongs to.
- 1 Emotion and Mood Recognition Experimental and Cognitive Psychology 4 works
- 2 Ethics and Social Impacts of AI Safety Research 3 works
- 3 Speech and dialogue systems Artificial Intelligence 2 works
- 4 Topic Modeling Artificial Intelligence 2 works
- 5 Multi-Agent Systems and Negotiation Artificial Intelligence 2 works
- 6 Face recognition and analysis Computer Vision and Pattern Recognition 2 works
- 7 Virtual Reality Applications and Impacts Human-Computer Interaction 2 works
- 8 Human-Automation Interaction and Safety Social Psychology 2 works
- 9 Artificial Intelligence in Healthcare and Education Health Informatics 2 works
- 10 Social Robot Interaction and HRI Social Psychology 2 works
How open and international is its research?
Against the world's own shares: the tick on each track. Both are shares of its output, so they sit on one scale and can be read against each other as well as against the world.
World: 40% of research is openly available.
World: 18% is written across borders.
How has Creative Technologies (United States)'s research output changed?
Output in 2022-2025 was 24% higher than in 2018-2021.
The same series as a ribbon: one cell per year, darker for more. The line above answers how much; this answers when.
Its share of all research
Growing output can still be a shrinking share: all of science grows. This is Creative Technologies (United States) as a percentage of every work published that year, 0.00056% in 2024.
Fractional works of Creative Technologies (United States) over all fractional works that year. How the balance of science has shifted.
How much of it reaches the world top 10%
Year by year, against all institutions in the same year.
Of each year's output, the share that reached the world's 10% most cited for its field and year. Peak 23.5% in 2011.
Other research institutions in Los Angeles
- University of California, Los Angeles
- University of Southern California
- Cedars-Sinai Medical Center
- Film Independent
- California State University Los Angeles
- Loyola Marymount University
- Doheny Eye Institute
- Occidental College


Share Creative Technologies (United States)'s ranking
Badges for a website1Each links back here and updates with every snapshot

Research measures only: rankings here say nothing about teaching, admissions or student experience. Comparable institutions and collaboration partners have tabs of their own, above.
Discussion
Ask a question or share a note about Creative Technologies (United States). Posts are plain text and can be reported.