Science Explorer Back to mapMap
Discussion
Government institution · Belfast · United Kingdom

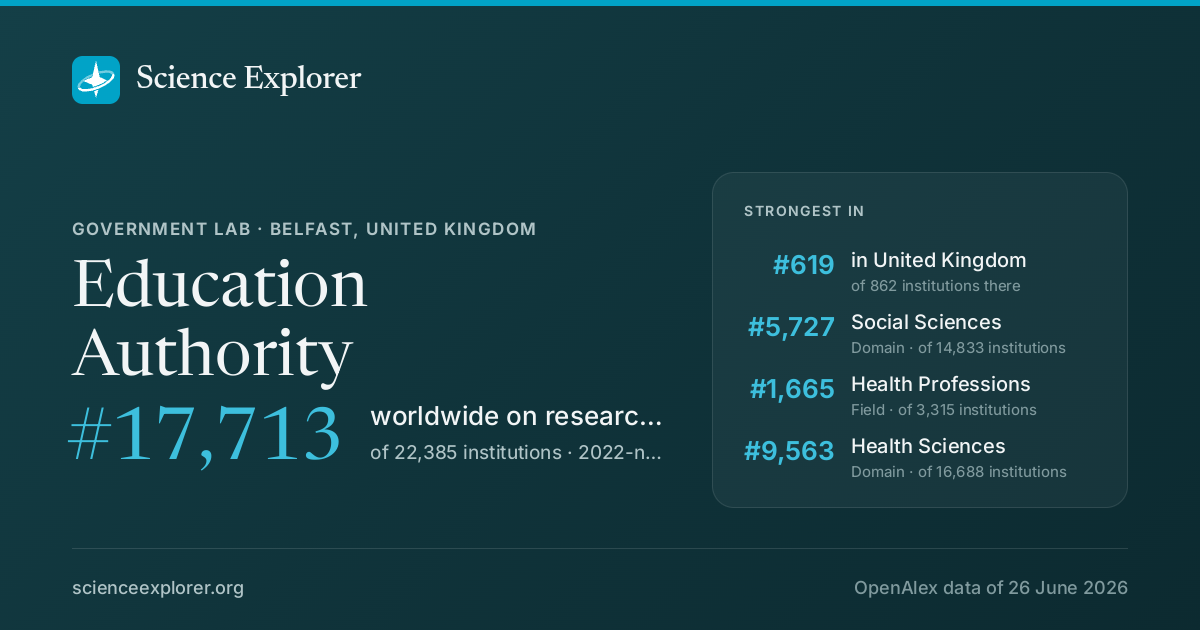
Education Authority

In research, Education Authority stands highest in Social Sciences (#5,727 of 14,833 worldwide), Health Professions (#1,665 of 3,315 worldwide) and Social Sciences (#4,812 of 9,330 worldwide), over all time.

World rank, 2022-now
#17,713
of 22,385 · #11,230 all time
Rank in United Kingdom
#619
of 862
Research works
816
▲ 130% vs 2018-21
Citations
8.7k
10.7 per fractional work
Top-10% rate
8.2%
all institutions 10.0%
vs its own fields
0.92×
1.00× is exactly expected
Open access
23%
world 40%
International
18%
world 18%

What is Education Authority known for in research?

The fields where it stands highest, over all time, ranked among every institution above the floor in each field.

FieldWorld rankWhere that sitsTop-10% rateWorks
Social SciencesDomain #5,727 of 14,833 7.1%436
Health ProfessionsField #1,665 of 3,315 7.9%124
Social SciencesField #4,812 of 9,330 7.4%245
Health SciencesDomain #9,563 of 16,688 7.2%245
EducationSubfield #2,167 of 3,033 7.5%133

Each strip is that field's whole ranked pool, with the notch where Education Authority sits in it, in the colour of the band that rank falls in. The track under the rate is the rate itself: it carries no average mark, because the average differs by field (from about 6% in Dentistry to 21% in Economics).

Which fields of science does Education Authority work in?

In 2022-now, 55% of research at Education Authority is in Social Sciences, 22% in Physical Sciences. Its largest fields are Social Sciences (29%), Medicine (10%), Arts and Humanities (9%). It does 2.1× the world's share of Social Sciences.

Social Sciences: 57 fractional works · 55.3% of its workSocial Sciences: 30 fractional works · 29.3% of its workEducation: 16 fractional works · 15.4% of its workSociology and Political Science: 7 fractional works · 6.7% of its workPolitical Science and International Relations: 3 fractional works · 2.8% of its workSafety Research: 1 fractional works · 1.3% of its workAnthropology: 1 fractional works · 0.8% of its workGender Studies: 0 fractional works · 0.4% of its workDemography: 0 fractional works · 0.4% of its workLaw: 0 fractional works · 0.3% of its workHealth: 0 fractional works · 0.3% of its workCommunication: 0 fractional works · 0.3% of its workHuman Factors and Ergonomics: 0 fractional works · 0.2% of its workSmaller subfields together: 0 fractional works · 0.4% of its workArts and Humanities: 9 fractional works · 9.0% of its workHistory: 3 fractional works · 2.6% of its workLanguage and Linguistics: 2 fractional works · 1.6% of its workArcheology: 1 fractional works · 1.2% of its workLiterature and Literary Theory: 1 fractional works · 1.1% of its workReligious studies: 1 fractional works · 1.0% of its workHistory and Philosophy of Science: 1 fractional works · 0.6% of its workPhilosophy: 1 fractional works · 0.6% of its workMuseology: 0 fractional works · 0.3% of its workPsychology: 8 fractional works · 7.4% of its workClinical Psychology: 3 fractional works · 3.2% of its workSocial Psychology: 2 fractional works · 2.1% of its workDevelopmental and Educational Psychology: 2 fractional works · 1.5% of its workExperimental and Cognitive Psychology: 1 fractional works · 0.6% of its workBusiness, Management and Accounting: 6 fractional works · 5.5% of its workStrategy and Management: 2 fractional works · 1.6% of its workAccounting: 1 fractional works · 1.1% of its workMarketing: 1 fractional works · 1.0% of its workManagement of Technology and Innovation: 1 fractional works · 0.8% of its workManagement Information Systems: 1 fractional works · 0.6% of its workOrganizational Behavior and Human Resource Management: 0 fractional works · 0.5% of its workEconomics, Econometrics and Finance: 3 fractional works · 2.8% of its workEconomics and Econometrics: 2 fractional works · 1.8% of its workGeneral Economics, Econometrics and Finance: 1 fractional works · 0.7% of its workFinance: 0 fractional works · 0.3% of its workDecision Sciences: 1 fractional works · 1.3% of its workManagement Science and Operations Research: 1 fractional works · 0.7% of its workInformation Systems and Management: 1 fractional works · 0.5% of its workSmaller subfields together: 0 fractional works · 0.0% of its workPhysical Sciences: 23 fractional works · 21.9% of its workComputer Science: 9 fractional works · 8.8% of its workInformation Systems: 4 fractional works · 3.6% of its workArtificial Intelligence: 3 fractional works · 2.7% of its workComputer Science Applications: 1 fractional works · 1.4% of its workComputer Networks and Communications: 1 fractional works · 0.7% of its workComputer Vision and Pattern Recognition: 0 fractional works · 0.4% of its workSmaller subfields together: 0 fractional works · 0.1% of its workEngineering: 5 fractional works · 5.2% of its workBuilding and Construction: 2 fractional works · 1.5% of its workMedia Technology: 1 fractional works · 1.0% of its workMechanical Engineering: 1 fractional works · 0.6% of its workBiomedical Engineering: 1 fractional works · 0.5% of its workCivil and Structural Engineering: 1 fractional works · 0.5% of its workSafety, Risk, Reliability and Quality: 0 fractional works · 0.4% of its workElectrical and Electronic Engineering: 0 fractional works · 0.3% of its workSmaller subfields together: 0 fractional works · 0.3% of its workEnvironmental Science: 5 fractional works · 5.2% of its workEcology: 2 fractional works · 1.5% of its workManagement, Monitoring, Policy and Law: 1 fractional works · 1.1% of its workWater Science and Technology: 1 fractional works · 0.7% of its workGlobal and Planetary Change: 1 fractional works · 0.6% of its workHealth, Toxicology and Mutagenesis: 0 fractional works · 0.4% of its workEnvironmental Engineering: 0 fractional works · 0.3% of its workEnvironmental Chemistry: 0 fractional works · 0.2% of its workNature and Landscape Conservation: 0 fractional works · 0.2% of its workSmaller subfields together: 0 fractional works · 0.1% of its workEarth and Planetary Sciences: 2 fractional works · 2.0% of its workGeophysics: 1 fractional works · 1.2% of its workGeology: 0 fractional works · 0.3% of its workOceanography: 0 fractional works · 0.3% of its workSmaller subfields together: 0 fractional works · 0.2% of its workChemistry: 0 fractional works · 0.5% of its workOrganic Chemistry: 0 fractional works · 0.5% of its workMathematics: 0 fractional works · 0.1% of its workEnergy: 0 fractional works · 0.1% of its workMaterials Science: 0 fractional works · 0.0% of its workChemical Engineering: 0 fractional works · 0.0% of its workPhysics and Astronomy: 0 fractional works · 0.0% of its workHealth Sciences: 19 fractional works · 18.7% of its workMedicine: 11 fractional works · 10.5% of its workPublic Health, Environmental and Occupational Health: 3 fractional works · 2.7% of its workPsychiatry and Mental health: 2 fractional works · 1.6% of its workPulmonary and Respiratory Medicine: 1 fractional works · 0.5% of its workRadiology, Nuclear Medicine and Imaging: 0 fractional works · 0.5% of its workEpidemiology: 0 fractional works · 0.4% of its workPhysiology: 0 fractional works · 0.4% of its workSurgery: 0 fractional works · 0.3% of its workNeurology: 0 fractional works · 0.3% of its workOncology: 0 fractional works · 0.3% of its workHematology: 0 fractional works · 0.3% of its workOrthopedics and Sports Medicine: 0 fractional works · 0.3% of its workEmergency Medicine: 0 fractional works · 0.3% of its workHealth Informatics: 0 fractional works · 0.2% of its workPediatrics, Perinatology and Child Health: 0 fractional works · 0.2% of its workOphthalmology: 0 fractional works · 0.2% of its workSmaller subfields together: 2 fractional works · 2.0% of its workHealth Professions: 6 fractional works · 6.2% of its workGeneral Health Professions: 3 fractional works · 3.0% of its workPhysical Therapy, Sports Therapy and Rehabilitation: 1 fractional works · 1.0% of its workEmergency Medical Services: 1 fractional works · 0.7% of its workComplementary and Manual Therapy: 1 fractional works · 0.6% of its workSpeech and Hearing: 0 fractional works · 0.5% of its workRadiological and Ultrasound Technology: 0 fractional works · 0.2% of its workSmaller subfields together: 0 fractional works · 0.2% of its workNursing: 1 fractional works · 1.3% of its workNutrition and Dietetics: 1 fractional works · 0.8% of its workResearch and Theory: 0 fractional works · 0.4% of its workSmaller subfields together: 0 fractional works · 0.1% of its workDentistry: 0 fractional works · 0.4% of its workPeriodontics: 0 fractional works · 0.4% of its workSmaller subfields together: 0 fractional works · 0.0% of its workVeterinary: 0 fractional works · 0.3% of its workLife Sciences: 4 fractional works · 4.0% of its workAgricultural and Biological Sciences: 2 fractional works · 2.0% of its workSoil Science: 1 fractional works · 1.0% of its workPlant Science: 0 fractional works · 0.2% of its workSmaller subfields together: 1 fractional works · 0.8% of its workNeuroscience: 1 fractional works · 1.0% of its workCognitive Neuroscience: 1 fractional works · 0.9% of its workSmaller subfields together: 0 fractional works · 0.1% of its workBiochemistry, Genetics and Molecular Biology: 1 fractional works · 0.9% of its workMolecular Biology: 0 fractional works · 0.3% of its workEndocrinology: 0 fractional works · 0.3% of its workSmaller subfields together: 0 fractional works · 0.3% of its workImmunology and Microbiology: 0 fractional works · 0.1% of its workALL ITS WORKEducationAuthority103fractional works, 2022-now
Life Sciences4%Physical Sciences22%Health Sciences19%Social Sciences55%

Each ring splits the one inside it: the four domains of science, their fields, their subfields. Size is fractional works in 2022-now. Every slice is a page; the interactive view zooms down to single topics and colours each by how much more of it this institution does than the world.

Its 4 domains and 25 fields, with their numbers
    1. Social Sciences3029.3%
    2. Arts and Humanities99.0%
    3. Psychology87.4%
    4. Business, Management and Accounting65.5%
    5. Economics, Econometrics and Finance32.8%
    6. Decision Sciences11.3%
    1. Computer Science98.8%
    2. Engineering55.2%
    3. Environmental Science55.2%
    4. Earth and Planetary Sciences22.0%
    5. Chemistry00.5%
    6. Mathematics00.1%
    7. Energy00.1%
    8. Materials Science00.0%
    9. Chemical Engineering00.0%
    10. Physics and Astronomy00.0%
    1. Medicine1110.5%
    2. Health Professions66.2%
    3. Nursing11.3%
    4. Dentistry00.4%
    5. Veterinary00.3%
    1. Agricultural and Biological Sciences22.0%
    2. Neuroscience11.0%
    3. Biochemistry, Genetics and Molecular Biology10.9%
    4. Immunology and Microbiology00.1%
All of science, and how each field's share has moved since 1950: the Science domain explorer

Field profile

Location quotient across every field it publishes in: outside the ring is more than an institution of this size would be expected to publish, inside it is less.

Agricultural and Biological Sciences: 0.43× its world share, 2 worksAgricultural and Bio…Biochemistry, Genetics and Molecular Biology: 0.17× its world share, 1 worksBiochemistry, Geneti…Immunology and Microbiology: 0.13× its world share, 0 worksImmunology and Micro…Neuroscience: 0.61× its world share, 1 worksNeuroscienceChemical Engineering: 0.09× its world share, 0 worksChemical EngineeringChemistry: 0.31× its world share, 0 worksChemistryComputer Science: 1.13× its world share, 9 worksComputer ScienceEarth and Planetary Sciences: 1.29× its world share, 2 worksEarth and Planetary …Energy: 0.09× its world share, 0 worksEnergyEngineering: 0.35× its world share, 5 worksEngineeringEnvironmental Science: 1.04× its world share, 5 worksEnvironmental ScienceMaterials Science: 0.01× its world share, 0 worksMaterials ScienceMathematics: 0.09× its world share, 0 worksMathematicsPhysics and Astronomy: 0.01× its world share, 0 worksPhysics and AstronomyDentistry: 0.83× its world share, 0 worksDentistryHealth Professions: 2.36× its world share, 6 worksHealth ProfessionsMedicine: 0.55× its world share, 11 worksMedicineNursing: 2.73× its world share, 1 worksNursingVeterinary: 1.98× its world share, 0 worksVeterinaryArts and Humanities: 3.11× its world share, 9 worksArts and HumanitiesBusiness, Management and Accounting: 1.70× its world share, 6 worksBusiness, Management…Decision Sciences: 1.32× its world share, 1 worksDecision SciencesEconomics, Econometrics and Finance: 1.31× its world share, 3 worksEconomics, Econometr…Psychology: 2.44× its world share, 8 worksPsychologySocial Sciences: 2.32× its world share, 30 worksSocial Sciences1×world share
more than its size predictsabout as predictedless

Rings at 0.5×, 1× and 2×. Widest outward: Arts and Humanities, 3.1×. Every wedge is a field page.

All 25 fields, with their numbers
  1. Arts and Humanities3.11×9 works
  2. Nursing2.73×1 works
  3. Psychology2.44×8 works
  4. Health Professions2.36×6 works
  5. Social Sciences2.32×30 works
  6. Veterinary1.98×0 works
  7. Business, Management and Accounting1.70×6 works
  8. Decision Sciences1.32×1 works
  9. Economics, Econometrics and Finance1.31×3 works
  10. Earth and Planetary Sciences1.29×2 works
  11. Computer Science1.13×9 works
  12. Environmental Science1.04×5 works
  13. Dentistry0.83×0 works
  14. Neuroscience0.61×1 works
  15. Medicine0.55×11 works
  16. Agricultural and Biological Sciences0.43×2 works
  17. Engineering0.35×5 works
  18. Chemistry0.31×0 works
  19. Biochemistry, Genetics and Molecular Biology0.17×1 works
  20. Immunology and Microbiology0.13×0 works
  21. Chemical Engineering0.09×0 works
  22. Energy0.09×0 works
  23. Mathematics0.09×0 works
  24. Materials Science0.01×0 works
  25. Physics and Astronomy0.01×0 works

Who are the top researchers at Education Authority?

Ranked on the quality score, Desmond L. Nuttall, Peter C. McIntosh and Dominic McVey lead among researchers whose main affiliation is Education Authority.

  1. 1 Desmond L. Nuttall United Kingdom · #1,172,493 worldwide 1.1k citations · 35 works
  2. 2 Peter C. McIntosh United Kingdom · #2,241,625 worldwide 278 citations · 19 works
  3. 3 Dominic McVey United Kingdom · #2,242,835 worldwide 827 citations · 28 works
  4. 4 Bernie Spain United Kingdom · #2,518,108 worldwide 272 citations · 30 works
  5. 5 Andrew Pates United Kingdom · #3,048,469 worldwide 13 citations · 38 works
  6. 6 JOHN B. DALBY United Kingdom · #3,148,529 worldwide 2 citations · 18 works
  7. 7 Céline Butté United Kingdom · #3,389,984 worldwide 15 citations · 18 works
  8. 8 Clive A. Lawton United Kingdom · #3,814,252 worldwide 54 citations · 21 works
  9. 9 Adrian King United Kingdom · #4,084,924 worldwide 29 citations · 16 works
  10. 10 Alison Walker United Kingdom · #4,149,439 worldwide 41 citations · 18 works
All ranked researchers at Education Authority

What are the most cited papers from Education Authority?

The most cited paper from Education Authority is "Ameliorating Early Reading Failure by Integrating the Teaching of Reading and Phonological Skills: The Phonological Linkage Hypothesis" (Peter J. Hatcher, Charles Hulme, Andrew W. Ellis, 1994), with 624 citations. Next come "Effectiveness of Alliances and Partnerships for Health Promotion" (414) and "The Relationship between Student Behaviour Patterns and Teacher Burnout" (387).

Most cited papers
#PaperReleasedCitations
1 Ameliorating Early Reading Failure by Integrating the Teaching of Reading and Phonological Skills: The Phonological Linkage Hypothesis Peter J. Hatcher, Charles Hulme, Andrew W. Ellis · Child Development Feb 1994 624
2 Effectiveness of Alliances and Partnerships for Health Promotion Pam Gillies · Health Promotion International 1998 414
3 The Relationship between Student Behaviour Patterns and Teacher Burnout Richard P. Hastings, Mohammed S. Bham · School Psychology International Feb 2003 387
4 Capturing quality in early childhood through environmental rating scales Κathy Sylva, Iram Siraj‐Blatchford, Brenda Taggart et al. · Early Childhood Research Quarterly 2006 343
5 Physical activity interventions using mass media, print media, and information technology BessH Marcus, Neville G. Owen, LeighAnnH Forsyth et al. · American Journal of Preventive Medicine Nov 1998 340
All 61 most cited papers, with filters and sorting

Which keywords describe research at Education Authority?

By fractional works in 2022-now, weighted toward what it does more of than the world: Online Learning, Technology Integration, History, Religion, Globalization, Educational Technology, Corruption and Sustainable Development.

▲ more of its work than of the world's◆ about the world's share▼ less than the world's

Size is fractional works in 2022-now in the topics tagged with each word; colour is the word's share of this institution's work against its share of the world's. The 40 words are chosen for being large and distinctive. Each links to the topic it comes from most.

All 40 words, with their numbers
  1. Globalization5▲ 2.5×16 topics
  2. Online Learning5▲ 5.3×6 topics
  3. Educational Technology4▲ 3.5×14 topics
  4. Sustainable Development4▲ 2.6×20 topics
  5. Education4▲ 2.2×14 topics
  6. History4▲ 5.2×9 topics
  7. Mental Health4▲ 2.5×15 topics
  8. Technology Integration4▲ 11×5 topics
  9. Public Health3▲ 2.3×16 topics
  10. Religion3▲ 6.9×7 topics
  11. E-Learning3▲ 3.3×6 topics
  12. Pedagogy3▲ 5.5×8 topics
  13. Risk Management3▲ 5.5×7 topics
  14. Identity3▲ 3.5×7 topics
  15. Resilience3▲ 5.2×7 topics
  16. Corruption2▲ 15×3 topics
  17. Professional Learning Communities2▲ 46×2 topics
  18. Governance2▲ 6.9×2 topics
  19. Literature2▲ 4.1×4 topics
  20. Smart Cities2▲ 8.5×3 topics
  21. Educational Leadership2▲ 17×2 topics
  22. Higher Education2▲ 4.1×9 topics
  23. Student Satisfaction2▲ 11×2 topics
  24. Teacher Professional Development2▲ 13×3 topics
  25. Urban Development2▲ 6.0×4 topics
  26. Child Development2▲ 4.9×4 topics
  27. Lifelong Learning2▲ 9.8×6 topics
  28. Reflective Practice2▲ 11×3 topics
  29. Coping Strategies2▲ 7.5×3 topics
  30. Democracy2▲ 5.5×3 topics
  31. Learning Analytics2▲ 15×2 topics
  32. Qualitative Research Methods2▲ 44×1 topic
  33. Teacher Identity2▲ 45×1 topic
  34. 21st Century Skills2▲ 6.0×3 topics
  35. Autism Spectrum Disorders2▲ 17×2 topics
  36. Institutions2▲ 23×2 topics
  37. Political Economy2▲ 6.9×2 topics
  38. MOOCs2▲ 18×2 topics
  39. Public Sector2▲ 36×2 topics
  40. Academic Achievement2▲ 8.9×5 topics

Which research topics does Education Authority publish most on?

By volume in 2022-now: Teacher Education and Leadership Studies, Family and Disability Support Research, Online Learning and Analytics and Corruption and Economic Development.

  1. 1 Teacher Education and Leadership Studies Education 2 works
  2. 2 Family and Disability Support Research Clinical Psychology 1 works
  3. 3 Online Learning and Analytics Computer Science Applications 1 works
  4. 4 Corruption and Economic Development Sociology and Political Science 1 works
  5. 5 Higher Education and Employability Education 1 works
  6. 6 Online and Blended Learning Education 1 works
  7. 7 Educational and Psychological Assessments Developmental and Educational Psychology 1 works
  8. 8 Islamic Thought and Society Studies Religious studies 1 works
  9. 9 Agricultural risk and resilience Soil Science 1 works
  10. 10 Child Nutrition and Feeding Issues Psychiatry and Mental health 1 works

How open and international is its research?

Against the world's own shares: the tick on each track. Both are shares of its output, so they sit on one scale and can be read against each other as well as against the world.

openly available23.2%not open76.8%

World: 40% of research is openly available.

with international co-authors17.7%domestic only82.3%

World: 18% is written across borders.

How has Education Authority's research output changed?

Output in 2022-2025 was 130% higher than in 2018-2021.

still counting1990200020102020
grewheldshrank

The same series as a ribbon: one cell per year, darker for more. The line above answers how much; this answers when.

Its share of all research

Growing output can still be a shrinking share: all of science grows. This is Education Authority as a percentage of every work published that year, 0.00033% in 2024.

still counting0.0020%0.0040%0.0060%Education Authority0.00052% in 202519801990200020102020

Fractional works of Education Authority over all fractional works that year. How the balance of science has shifted.

How much of it reaches the world top 10%

Year by year, against all institutions in the same year.

still counting5%10%15%all institutions10.0% in 2025Education Authority7.0% in 2025200020102020

Of each year's output, the share that reached the world's 10% most cited for its field and year. Peak 9.0% in 1994.

Other research institutions in Belfast

All research institutions in Belfast

Share Education Authority's ranking

Education Authority on Science Explorer

A card with Education Authority's standing and the fields it leads in, for a post or a slide. A link to this page previews as the same card.

Download the card

1200 × 630 PNG, sized for social posts, drawn from the latest snapshot.

Badges for a website1Each links back here and updates with every snapshot

Research measures only: rankings here say nothing about teaching, admissions or student experience. Comparable institutions and collaboration partners have tabs of their own, above.

Discussion

Ask a question or share a note about Education Authority. Posts are plain text and can be reported.