Science Explorer Back to mapMap
Discussion
Company · Southlake · United States

Sabre (United States)

World rank, all time
#32,887
of 34,923
Rank in United States
#6,904
of 7,310
Research works
133
▼ 21% vs 2018-21
Citations
3.1k
23.6 per fractional work
Top-10% rate
8.7%
all institutions 10.0%
vs its own fields
0.91×
1.00× is exactly expected
Open access
16%
world 40%
International
19%
world 18%

Which fields of science does Sabre (United States) work in?

In all years, 49% of research at Sabre (United States) is in Social Sciences, 43% in Physical Sciences. Its largest fields are Business, Management and Accounting (23%), Engineering (22%), Computer Science (14%). It does 2.2× the world's share of Social Sciences.

Social Sciences: 65 fractional works · 48.6% of its workBusiness, Management and Accounting: 31 fractional works · 23.3% of its workManagement Information Systems: 15 fractional works · 11.5% of its workMarketing: 10 fractional works · 7.1% of its workStrategy and Management: 5 fractional works · 3.5% of its workOrganizational Behavior and Human Resource Management: 1 fractional works · 0.7% of its workManagement of Technology and Innovation: 1 fractional works · 0.5% of its workEconomics, Econometrics and Finance: 14 fractional works · 10.6% of its workGeneral Economics, Econometrics and Finance: 11 fractional works · 8.3% of its workEconomics and Econometrics: 3 fractional works · 2.0% of its workFinance: 0 fractional works · 0.3% of its workDecision Sciences: 11 fractional works · 8.3% of its workManagement Science and Operations Research: 8 fractional works · 6.3% of its workStatistics, Probability and Uncertainty: 2 fractional works · 1.4% of its workInformation Systems and Management: 1 fractional works · 0.6% of its workSocial Sciences: 8 fractional works · 5.6% of its workTransportation: 5 fractional works · 3.4% of its workSociology and Political Science: 2 fractional works · 1.4% of its workPolitical Science and International Relations: 1 fractional works · 0.5% of its workDevelopment: 0 fractional works · 0.2% of its workSmaller subfields together: 0 fractional works · 0.1% of its workArts and Humanities: 1 fractional works · 0.5% of its workPhilosophy: 0 fractional works · 0.2% of its workReligious studies: 0 fractional works · 0.2% of its workPsychology: 0 fractional works · 0.2% of its workPhysical Sciences: 58 fractional works · 43.3% of its workEngineering: 30 fractional works · 22.4% of its workIndustrial and Manufacturing Engineering: 11 fractional works · 8.6% of its workAutomotive Engineering: 6 fractional works · 4.5% of its workAerospace Engineering: 4 fractional works · 3.2% of its workControl and Systems Engineering: 2 fractional works · 1.8% of its workBuilding and Construction: 2 fractional works · 1.4% of its workElectrical and Electronic Engineering: 1 fractional works · 0.9% of its workMechanical Engineering: 1 fractional works · 0.6% of its workOcean Engineering: 0 fractional works · 0.4% of its workBiomedical Engineering: 0 fractional works · 0.3% of its workComputational Mechanics: 0 fractional works · 0.2% of its workMechanics of Materials: 0 fractional works · 0.2% of its workSmaller subfields together: 0 fractional works · 0.3% of its workComputer Science: 18 fractional works · 13.7% of its workInformation Systems: 6 fractional works · 4.2% of its workArtificial Intelligence: 4 fractional works · 2.7% of its workComputer Networks and Communications: 3 fractional works · 2.3% of its workSoftware: 3 fractional works · 2.0% of its workComputational Theory and Mathematics: 1 fractional works · 1.1% of its workComputer Vision and Pattern Recognition: 1 fractional works · 0.7% of its workSignal Processing: 1 fractional works · 0.4% of its workHardware and Architecture: 0 fractional works · 0.3% of its workSmaller subfields together: 0 fractional works · 0.1% of its workEnergy: 3 fractional works · 2.0% of its workRenewable Energy, Sustainability and the Environment: 2 fractional works · 1.9% of its workSmaller subfields together: 0 fractional works · 0.1% of its workMathematics: 2 fractional works · 1.5% of its workStatistics and Probability: 1 fractional works · 1.0% of its workNumerical Analysis: 0 fractional works · 0.3% of its workSmaller subfields together: 0 fractional works · 0.2% of its workChemistry: 1 fractional works · 1.1% of its workPhysical and Theoretical Chemistry: 0 fractional works · 0.4% of its workOrganic Chemistry: 0 fractional works · 0.3% of its workInorganic Chemistry: 0 fractional works · 0.2% of its workSmaller subfields together: 0 fractional works · 0.2% of its workPhysics and Astronomy: 1 fractional works · 1.0% of its workStatistical and Nonlinear Physics: 1 fractional works · 0.7% of its workAstronomy and Astrophysics: 0 fractional works · 0.2% of its workSmaller subfields together: 0 fractional works · 0.1% of its workEnvironmental Science: 1 fractional works · 0.9% of its workEnvironmental Engineering: 1 fractional works · 0.4% of its workGlobal and Planetary Change: 0 fractional works · 0.2% of its workSmaller subfields together: 0 fractional works · 0.3% of its workMaterials Science: 1 fractional works · 0.5% of its workMaterials Chemistry: 0 fractional works · 0.3% of its workSmaller subfields together: 0 fractional works · 0.2% of its workChemical Engineering: 0 fractional works · 0.2% of its workFluid Flow and Transfer Processes: 0 fractional works · 0.2% of its workHealth Sciences: 8 fractional works · 5.6% of its workMedicine: 5 fractional works · 3.8% of its workEpidemiology: 2 fractional works · 1.2% of its workPediatrics, Perinatology and Child Health: 1 fractional works · 0.4% of its workPublic Health, Environmental and Occupational Health: 0 fractional works · 0.3% of its workObstetrics and Gynecology: 0 fractional works · 0.2% of its workCardiology and Cardiovascular Medicine: 0 fractional works · 0.2% of its workDermatology: 0 fractional works · 0.2% of its workSmaller subfields together: 2 fractional works · 1.1% of its workHealth Professions: 2 fractional works · 1.8% of its workGeneral Health Professions: 1 fractional works · 0.9% of its workEmergency Medical Services: 1 fractional works · 0.7% of its workSmaller subfields together: 0 fractional works · 0.2% of its workNursing: 0 fractional works · 0.1% of its workLife Sciences: 3 fractional works · 2.4% of its workAgricultural and Biological Sciences: 1 fractional works · 1.1% of its workForestry: 1 fractional works · 0.8% of its workFood Science: 0 fractional works · 0.3% of its workSmaller subfields together: 0 fractional works · 0.1% of its workBiochemistry, Genetics and Molecular Biology: 1 fractional works · 0.5% of its workMolecular Biology: 0 fractional works · 0.3% of its workSmaller subfields together: 0 fractional works · 0.2% of its workPharmacology, Toxicology and Pharmaceutics: 0 fractional works · 0.3% of its workPharmaceutical Science: 0 fractional works · 0.3% of its workNeuroscience: 0 fractional works · 0.3% of its workImmunology and Microbiology: 0 fractional works · 0.1% of its workALL ITS WORKSabre (UnitedStates)133fractional works, all years
Life Sciences2%Physical Sciences43%Health Sciences6%Social Sciences49%

Each ring splits the one inside it: the four domains of science, their fields, their subfields. Size is fractional works in all years. Every slice is a page; the interactive view zooms down to single topics and colours each by how much more of it this institution does than the world.

Its 4 domains and 23 fields, with their numbers
    1. Business, Management and Accounting3123.3%
    2. Economics, Econometrics and Finance1410.6%
    3. Decision Sciences118.3%
    4. Social Sciences85.6%
    5. Arts and Humanities10.5%
    6. Psychology00.2%
    1. Engineering3022.4%
    2. Computer Science1813.7%
    3. Energy32.0%
    4. Mathematics21.5%
    5. Chemistry11.1%
    6. Physics and Astronomy11.0%
    7. Environmental Science10.9%
    8. Materials Science10.5%
    9. Chemical Engineering00.2%
    1. Medicine53.8%
    2. Health Professions21.8%
    3. Nursing00.1%
    1. Agricultural and Biological Sciences11.1%
    2. Biochemistry, Genetics and Molecular Biology10.5%
    3. Pharmacology, Toxicology and Pharmaceutics00.3%
    4. Neuroscience00.3%
    5. Immunology and Microbiology00.1%
All of science, and how each field's share has moved since 1950: the Science domain explorer

Field profile

Location quotient across every field it publishes in: outside the ring is more than an institution of this size would be expected to publish, inside it is less.

Agricultural and Biological Sciences: 0.47× its world share, 0 worksAgricultural and Bio…Biochemistry, Genetics and Molecular Biology: 0.53× its world share, 0 worksBiochemistry, Geneti…Immunology and Microbiology: 0.97× its world share, 0 worksImmunology and Micro…Neuroscience: 1.53× its world share, 0 worksNeurosciencePharmacology, Toxicology and Pharmaceutics: 7.41× its world share, 0 worksPharmacology, Toxico…Chemistry: 4.79× its world share, 1 worksChemistryComputer Science: 1.26× its world share, 2 worksComputer ScienceEnergy: 0.71× its world share, 0 worksEnergyEngineering: 1.00× its world share, 3 worksEngineeringEnvironmental Science: 0.33× its world share, 0 worksEnvironmental ScienceMaterials Science: 1.13× its world share, 1 worksMaterials SciencePhysics and Astronomy: 0.62× its world share, 0 worksPhysics and AstronomyHealth Professions: 0.81× its world share, 0 worksHealth ProfessionsMedicine: 0.74× its world share, 2 worksMedicineBusiness, Management and Accounting: 2.13× its world share, 1 worksBusiness, Management…Decision Sciences: 7.09× its world share, 1 worksDecision SciencesEconomics, Econometrics and Finance: 7.32× its world share, 3 worksEconomics, Econometr…Social Sciences: 0.26× its world share, 1 worksSocial Sciences1×world share
more than its size predictsabout as predictedless

Rings at 0.5×, 1× and 2×. Widest outward: Pharmacology, Toxicology and Pharmaceutics, 7.4×. Every wedge is a field page.

All 18 fields, with their numbers
  1. Pharmacology, Toxicology and Pharmaceutics7.41×0 works
  2. Economics, Econometrics and Finance7.32×3 works
  3. Decision Sciences7.09×1 works
  4. Chemistry4.79×1 works
  5. Business, Management and Accounting2.13×1 works
  6. Neuroscience1.53×0 works
  7. Computer Science1.26×2 works
  8. Materials Science1.13×1 works
  9. Engineering1.00×3 works
  10. Immunology and Microbiology0.97×0 works
  11. Health Professions0.81×0 works
  12. Medicine0.74×2 works
  13. Energy0.71×0 works
  14. Physics and Astronomy0.62×0 works
  15. Biochemistry, Genetics and Molecular Biology0.53×0 works
  16. Agricultural and Biological Sciences0.47×0 works
  17. Environmental Science0.33×0 works
  18. Social Sciences0.26×1 works

Who are the top researchers at Sabre (United States)?

Ranked on the quality score, Sergey Shebalov, Richard M Ratliff and B. Venkateshwara Rao lead among researchers whose main affiliation is Sabre (United States).

  1. 1 Sergey Shebalov United States · #1,780,150 worldwide 559 citations · 15 works
  2. 2 Richard M Ratliff United States · #2,277,704 worldwide 901 citations · 24 works
  3. 3 B. Venkateshwara Rao United States · #2,769,597 worldwide 420 citations · 16 works
All ranked researchers at Sabre (United States)

What are the most cited papers from Sabre (United States)?

The most cited paper from Sabre (United States) is "Purchasing organization involvement in risk assessments, contingency plans, and risk management: an exploratory study" (George A. Zsidisin, Alex Panelli, R. Travis Upton, 2000), with 442 citations. Next come "Estimating Primary Demand for Substitutable Products from Sales Transaction Data" (279) and "Flight operations recovery: New approaches considering passenger recovery" (240).

Most cited papers
#PaperReleasedCitations
1 Purchasing organization involvement in risk assessments, contingency plans, and risk management: an exploratory study George A. Zsidisin, Alex Panelli, R. Travis Upton · Supply Chain Management An International Journal Oct 2000 442
2 Estimating Primary Demand for Substitutable Products from Sales Transaction Data Gustavo J. Vulcano, Garrett van Ryzin, Richard M Ratliff · Operations Research Apr 2012 279
3 Flight operations recovery: New approaches considering passenger recovery Stephane Bratu, Cynthia Barnhart · Journal of Scheduling 7 May 2006 240
4 OM Practice —Choice-Based Revenue Management: An Empirical Study of Estimation and Optimization Gustavo J. Vulcano, Garrett van Ryzin, Wassim Chaar · Manufacturing & Service Operations Management 13 Nov 2009 198
5 Obtaining lower bounds from the progressive hedging algorithm for stochastic mixed-integer programs Dinakar Gade, Gabriel A. Hackebeil, Sarah M. Ryan et al. · Mathematical Programming Open access 2 Apr 2016 194
All 60 most cited papers, with filters and sorting

Which keywords describe research at Sabre (United States)?

By fractional works in all years, weighted toward what it does more of than the world: Demand Forecasting, Inventory Management, Market Power, Risk Management, Airport Competition, High-speed Rail, Dynamic Pricing and Information Sharing.

▲ more of its work than of the world's◆ about the world's share▼ less than the world's

Size is fractional works in all years in the topics tagged with each word; colour is the word's share of this institution's work against its share of the world's. The 40 words are chosen for being large and distinctive. Each links to the topic it comes from most.

All 40 words, with their numbers
  1. Demand Forecasting12▲ 191×2 topics
  2. Inventory Management12▲ 112×2 topics
  3. Market Power11▲ 146×4 topics
  4. Airport Competition11▲ 615×1 topic
  5. High-speed Rail11▲ 615×1 topic
  6. Risk Management11▲ 23×3 topics
  7. Dynamic Pricing11▲ 192×2 topics
  8. Information Sharing11▲ 117×2 topics
  9. Revenue Management10▲ 285×1 topic
  10. Supply Chain Coordination10▲ 285×1 topic
  11. E-commerce9▲ 22×3 topics
  12. Consumer Behavior8▲ 16×3 topics
  13. Supply Chain Management8▲ 11×11 topics
  14. Sustainability7▲ 3.1×10 topics
  15. Marketing Strategies7▲ 51×1 topic
  16. Retail Economics7▲ 186×1 topic
  17. Environmental Impacts7▲ 23×2 topics
  18. Ridesharing5▲ 129×1 topic
  19. Shared Autonomous Vehicles5▲ 129×1 topic
  20. Heuristic Algorithms5▲ 89×2 topics
  21. Metaheuristics5▲ 48×3 topics
  22. Risk Assessment5▲ 5.8×3 topics
  23. Supply Chain5▲ 20×4 topics
  24. Travel Behavior4▲ 44×2 topics
  25. Agent-Based Modeling4▲ 20×5 topics
  26. Tabu Search4▲ 152×1 topic
  27. Vehicle Routing Problem4▲ 152×1 topic
  28. User Satisfaction4▲ 19×2 topics
  29. Dynamic Scheduling4▲ 49×2 topics
  30. Public Transport4▲ 46×1 topic
  31. Service Quality4▲ 15×1 topic
  32. Collision Avoidance3▲ 21×3 topics
  33. Requirements Engineering3▲ 36×2 topics
  34. Air Traffic Management3▲ 139×1 topic
  35. Conflict Resolution3▲ 77×1 topic
  36. Genetic Algorithm3▲ 12×4 topics
  37. Logistics3▲ 19×3 topics
  38. Operations Research3▲ 28×2 topics
  39. Scheduling3▲ 23×3 topics
  40. Sensitivity Analysis3▲ 16×3 topics

Which research topics does Sabre (United States) publish most on?

By volume in 2022-now: Aviation Industry Analysis and Trends, Acute Ischemic Stroke Management, Forecasting Techniques and Applications and Supply Chain and Inventory Management.

  1. 1 Aviation Industry Analysis and Trends General Economics, Econometrics and Finance 1 works
  2. 2 Acute Ischemic Stroke Management Epidemiology 1 works
  3. 3 Forecasting Techniques and Applications Management Science and Operations Research 1 works
  4. 4 Supply Chain and Inventory Management Management Information Systems 1 works
  5. 5 Economic and Environmental Valuation Economics and Econometrics 1 works
  6. 6 Natural Language Processing Techniques Artificial Intelligence 0 works
  7. 7 Transportation Planning and Optimization Transportation 0 works
  8. 8 Multimodal Machine Learning Applications Computer Vision and Pattern Recognition 0 works
  9. 9 Consumer Market Behavior and Pricing Marketing 0 works
  10. 10 Supramolecular Chemistry and Complexes Organic Chemistry 0 works

How open and international is its research?

Against the world's own shares: the tick on each track. Both are shares of its output, so they sit on one scale and can be read against each other as well as against the world.

openly available16.2%not open83.8%

World: 40% of research is openly available.

with international co-authors18.7%domestic only81.3%

World: 18% is written across borders.

How has Sabre (United States)'s research output changed?

Output in 2022-2025 was 21% lower than in 2018-2021.

still counting1990200020102020
grewheldshrank

The same series as a ribbon: one cell per year, darker for more. The line above answers how much; this answers when.

Its share of all research

Growing output can still be a shrinking share: all of science grows. This is Sabre (United States) as a percentage of every work published that year, 0.000061% in 2024.

still counting0.00020%0.00040%0.00060%Sabre (United States)0.000040% in 20251990200020102020

Fractional works of Sabre (United States) over all fractional works that year. How the balance of science has shifted.

Other research institutions in Southlake

All research institutions in Southlake

Share Sabre (United States)'s ranking
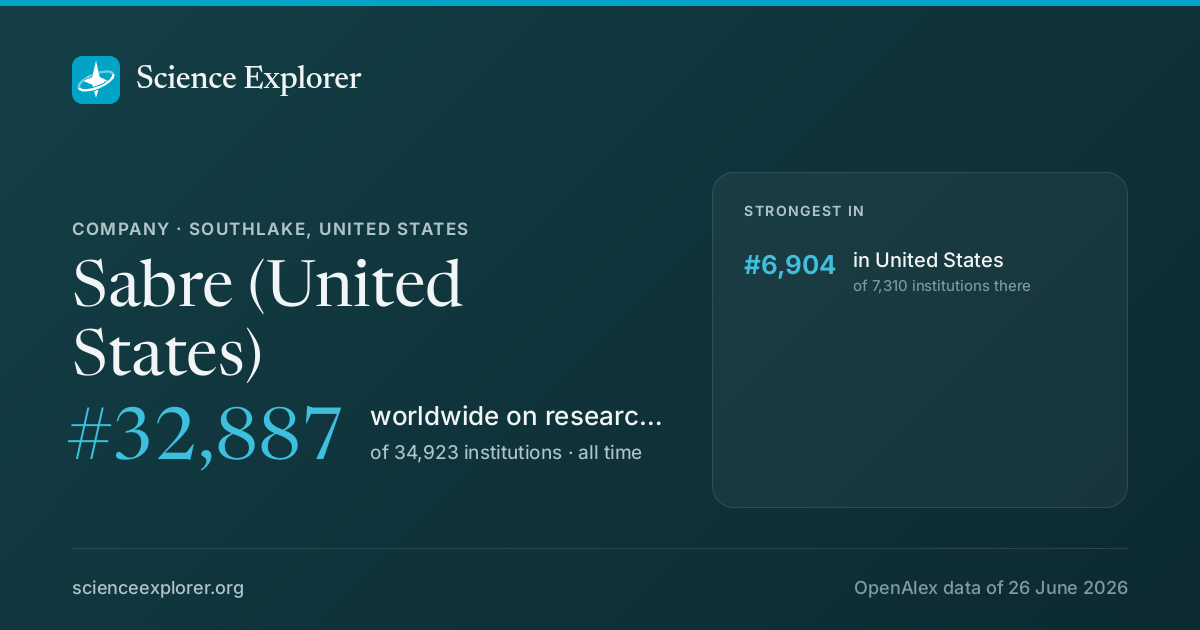
Sabre (United States) on Science Explorer

A card with Sabre (United States)'s standing and the fields it leads in, for a post or a slide. A link to this page previews as the same card.

Download the card

1200 × 630 PNG, sized for social posts, drawn from the latest snapshot.

Badges for a website1Each links back here and updates with every snapshot

Research measures only: rankings here say nothing about teaching, admissions or student experience. Comparable institutions and collaboration partners have tabs of their own, above.

Discussion

Ask a question or share a note about Sabre (United States). Keep it to the research: no personal attacks, advertising or links. Any reader can report a post, which collapses it for everyone until it is opened.
