Science Explorer Back to mapMap
Discussion
University · Dayton · United States

Sinclair Community College

In research, Sinclair Community College stands highest in Physical Sciences (#15,628 of 17,446 worldwide), over all time.

World rank, all time
#17,225
of 34,923
Rank in United States
#3,580
of 7,310
Research works
344
▼ 43% vs 2018-21
Citations
4.6k
13.5 per fractional work
Top-10% rate
4.7%
all institutions 10.0%
vs its own fields
0.87×
1.00× is exactly expected
Open access
22%
world 40%
International
10%
world 18%

What is Sinclair Community College known for in research?

The fields where it stands highest, over all time, ranked among every institution above the floor in each field.

FieldWorld rankWhere that sitsTop-10% rateWorks
Physical SciencesDomain #15,628 of 17,446 4.9%123

Each strip is that field's whole ranked pool, with the notch where Sinclair Community College sits in it, in the colour of the band that rank falls in. The track under the rate is the rate itself: it carries no average mark, because the average differs by field (from about 6% in Dentistry to 21% in Economics).

Which fields of science does Sinclair Community College work in?

In 2022-now, 52% of research at Sinclair Community College is in Social Sciences, 24% in Health Sciences. Its largest fields are Social Sciences (34%), Medicine (16%), Engineering (11%). It does 1.8× the world's share of Social Sciences.

Social Sciences: 19 fractional works · 51.9% of its workSocial Sciences: 12 fractional works · 33.5% of its workSociology and Political Science: 5 fractional works · 12.7% of its workEducation: 2 fractional works · 6.1% of its workDemography: 1 fractional works · 3.3% of its workUrban Studies: 1 fractional works · 2.9% of its workPolitical Science and International Relations: 1 fractional works · 2.8% of its workAnthropology: 1 fractional works · 1.9% of its workGender Studies: 1 fractional works · 1.6% of its workGeography, Planning and Development: 0 fractional works · 1.1% of its workCommunication: 0 fractional works · 0.3% of its workCultural Studies: 0 fractional works · 0.3% of its workHealth: 0 fractional works · 0.3% of its workSafety Research: 0 fractional works · 0.3% of its workArts and Humanities: 2 fractional works · 5.4% of its workLiterature and Literary Theory: 1 fractional works · 2.2% of its workHistory: 1 fractional works · 1.9% of its workVisual Arts and Performing Arts: 0 fractional works · 1.4% of its workPsychology: 2 fractional works · 5.2% of its workClinical Psychology: 1 fractional works · 2.0% of its workSocial Psychology: 1 fractional works · 2.0% of its workExperimental and Cognitive Psychology: 0 fractional works · 0.7% of its workDevelopmental and Educational Psychology: 0 fractional works · 0.5% of its workBusiness, Management and Accounting: 2 fractional works · 4.2% of its workMarketing: 1 fractional works · 1.9% of its workManagement of Technology and Innovation: 0 fractional works · 0.9% of its workTourism, Leisure and Hospitality Management: 0 fractional works · 0.9% of its workOrganizational Behavior and Human Resource Management: 0 fractional works · 0.5% of its workEconomics, Econometrics and Finance: 1 fractional works · 2.8% of its workFinance: 1 fractional works · 1.9% of its workEconomics and Econometrics: 0 fractional works · 0.9% of its workDecision Sciences: 0 fractional works · 0.8% of its workStatistics, Probability and Uncertainty: 0 fractional works · 0.5% of its workSmaller subfields together: 0 fractional works · 0.3% of its workHealth Sciences: 9 fractional works · 23.7% of its workMedicine: 6 fractional works · 16.1% of its workPublic Health, Environmental and Occupational Health: 1 fractional works · 3.5% of its workPediatrics, Perinatology and Child Health: 1 fractional works · 1.8% of its workPhysiology: 1 fractional works · 1.6% of its workSurgery: 0 fractional works · 1.2% of its workDermatology: 0 fractional works · 1.2% of its workReproductive Medicine: 0 fractional works · 0.9% of its workGeriatrics and Gerontology: 0 fractional works · 0.9% of its workEpidemiology: 0 fractional works · 0.8% of its workNeurology: 0 fractional works · 0.5% of its workPsychiatry and Mental health: 0 fractional works · 0.5% of its workUrology: 0 fractional works · 0.5% of its workPulmonary and Respiratory Medicine: 0 fractional works · 0.4% of its workAnesthesiology and Pain Medicine: 0 fractional works · 0.3% of its workCardiology and Cardiovascular Medicine: 0 fractional works · 0.3% of its workCritical Care and Intensive Care Medicine: 0 fractional works · 0.3% of its workHealth Informatics: 0 fractional works · 0.3% of its workObstetrics and Gynecology: 0 fractional works · 0.3% of its workEndocrinology, Diabetes and Metabolism: 0 fractional works · 0.2% of its workSmaller subfields together: 0 fractional works · 0.6% of its workHealth Professions: 2 fractional works · 6.8% of its workGeneral Health Professions: 1 fractional works · 4.0% of its workHealth Information Management: 0 fractional works · 1.1% of its workPhysical Therapy, Sports Therapy and Rehabilitation: 0 fractional works · 0.6% of its workSpeech and Hearing: 0 fractional works · 0.5% of its workEmergency Medical Services: 0 fractional works · 0.4% of its workSmaller subfields together: 0 fractional works · 0.1% of its workNursing: 0 fractional works · 0.9% of its workIssues, ethics and legal aspects: 0 fractional works · 0.9% of its workPhysical Sciences: 6 fractional works · 17.9% of its workEngineering: 4 fractional works · 10.7% of its workAerospace Engineering: 1 fractional works · 3.5% of its workElectrical and Electronic Engineering: 1 fractional works · 3.2% of its workBiomedical Engineering: 0 fractional works · 1.4% of its workCivil and Structural Engineering: 0 fractional works · 1.4% of its workMechanical Engineering: 0 fractional works · 1.2% of its workSmaller subfields together: 0 fractional works · 0.1% of its workComputer Science: 1 fractional works · 3.5% of its workArtificial Intelligence: 1 fractional works · 1.5% of its workComputer Science Applications: 0 fractional works · 0.9% of its workInformation Systems: 0 fractional works · 0.5% of its workComputer Vision and Pattern Recognition: 0 fractional works · 0.4% of its workSmaller subfields together: 0 fractional works · 0.2% of its workPhysics and Astronomy: 1 fractional works · 1.5% of its workAstronomy and Astrophysics: 0 fractional works · 1.3% of its workSmaller subfields together: 0 fractional works · 0.2% of its workEnvironmental Science: 0 fractional works · 1.4% of its workEnvironmental Chemistry: 0 fractional works · 0.5% of its workGlobal and Planetary Change: 0 fractional works · 0.5% of its workWater Science and Technology: 0 fractional works · 0.5% of its workMaterials Science: 0 fractional works · 0.6% of its workSurfaces, Coatings and Films: 0 fractional works · 0.5% of its workSmaller subfields together: 0 fractional works · 0.2% of its workMathematics: 0 fractional works · 0.2% of its workLife Sciences: 2 fractional works · 6.5% of its workBiochemistry, Genetics and Molecular Biology: 1 fractional works · 2.7% of its workGenetics: 0 fractional works · 1.4% of its workMolecular Biology: 0 fractional works · 1.3% of its workNeuroscience: 1 fractional works · 2.1% of its workCognitive Neuroscience: 1 fractional works · 1.8% of its workCellular and Molecular Neuroscience: 0 fractional works · 0.4% of its workSmaller subfields together: 0 fractional works · 0.0% of its workAgricultural and Biological Sciences: 1 fractional works · 1.6% of its workFood Science: 0 fractional works · 0.9% of its workPlant Science: 0 fractional works · 0.5% of its workSmaller subfields together: 0 fractional works · 0.2% of its workALL ITS WORKSinclairCommunity College36fractional works, 2022-now
Life Sciences6%Physical Sciences18%Health Sciences24%Social Sciences52%

Each ring splits the one inside it: the four domains of science, their fields, their subfields. Size is fractional works in 2022-now. Every slice is a page; the interactive view zooms down to single topics and colours each by how much more of it this institution does than the world.

Its 4 domains and 18 fields, with their numbers
    1. Social Sciences1233.5%
    2. Arts and Humanities25.4%
    3. Psychology25.2%
    4. Business, Management and Accounting24.2%
    5. Economics, Econometrics and Finance12.8%
    6. Decision Sciences00.8%
    1. Medicine616.1%
    2. Health Professions26.8%
    3. Nursing00.9%
    1. Engineering410.7%
    2. Computer Science13.5%
    3. Physics and Astronomy11.5%
    4. Environmental Science01.4%
    5. Materials Science00.6%
    6. Mathematics00.2%
    1. Biochemistry, Genetics and Molecular Biology12.7%
    2. Neuroscience12.1%
    3. Agricultural and Biological Sciences11.6%
All of science, and how each field's share has moved since 1950: the Science domain explorer

Field profile

Location quotient across every field it publishes in: outside the ring is more than an institution of this size would be expected to publish, inside it is less.

Agricultural and Biological Sciences: 0.33× its world share, 1 worksAgricultural and Bio…Biochemistry, Genetics and Molecular Biology: 0.51× its world share, 1 worksBiochemistry, Geneti…Neuroscience: 1.32× its world share, 1 worksNeuroscienceComputer Science: 0.45× its world share, 1 worksComputer ScienceEngineering: 0.71× its world share, 4 worksEngineeringEnvironmental Science: 0.28× its world share, 0 worksEnvironmental ScienceMaterials Science: 0.19× its world share, 0 worksMaterials ScienceMathematics: 0.16× its world share, 0 worksMathematicsPhysics and Astronomy: 0.66× its world share, 0 worksPhysics and AstronomyHealth Professions: 2.56× its world share, 2 worksHealth ProfessionsMedicine: 0.84× its world share, 6 worksMedicineNursing: 1.89× its world share, 0 worksNursingArts and Humanities: 1.87× its world share, 2 worksArts and HumanitiesBusiness, Management and Accounting: 1.30× its world share, 2 worksBusiness, Management…Decision Sciences: 0.83× its world share, 0 worksDecision SciencesEconomics, Econometrics and Finance: 1.30× its world share, 1 worksEconomics, Econometr…Psychology: 1.72× its world share, 2 worksPsychologySocial Sciences: 2.65× its world share, 12 worksSocial Sciences1×world share
more than its size predictsabout as predictedless

Rings at 0.5×, 1× and 2×. Widest outward: Social Sciences, 2.6×. Every wedge is a field page.

All 18 fields, with their numbers
  1. Social Sciences2.65×12 works
  2. Health Professions2.56×2 works
  3. Nursing1.89×0 works
  4. Arts and Humanities1.87×2 works
  5. Psychology1.72×2 works
  6. Neuroscience1.32×1 works
  7. Business, Management and Accounting1.30×2 works
  8. Economics, Econometrics and Finance1.30×1 works
  9. Medicine0.84×6 works
  10. Decision Sciences0.83×0 works
  11. Engineering0.71×4 works
  12. Physics and Astronomy0.66×0 works
  13. Biochemistry, Genetics and Molecular Biology0.51×1 works
  14. Computer Science0.45×1 works
  15. Agricultural and Biological Sciences0.33×1 works
  16. Environmental Science0.28×0 works
  17. Materials Science0.19×0 works
  18. Mathematics0.16×0 works

Who are the top researchers at Sinclair Community College?

Ranked on the quality score, Solomon M. Fulero, Jacqueline A. Housel and Jason Liu lead among researchers whose main affiliation is Sinclair Community College.

  1. 1 Solomon M. Fulero United States · #661,334 worldwide 3.4k citations · 60 works
  2. 2 Jacqueline A. Housel United States · #1,348,573 worldwide 443 citations · 15 works
  3. 3 Jason Liu United States · #1,891,929 worldwide 298 citations · 37 works
  4. 4 Brent Maxfield United States · #2,558,473 worldwide 41 citations · 56 works
  5. 5 Brian Cafarella United States · #3,315,030 worldwide 31 citations · 37 works
  6. 6 Katherine R. Rowell United States · #3,427,139 worldwide 289 citations · 16 works
  7. 7 Lisa Tyler United States · #3,762,798 worldwide 388 citations · 69 works
  8. 8 Philip A. Chenoweth United States · #4,763,537 worldwide 61 citations · 26 works
  9. 9 Becker De United States · #4,794,824 worldwide 52 citations · 17 works
  10. 9 Anne E McCrea United States · #4,794,824 worldwide 513 citations · 17 works
All ranked researchers at Sinclair Community College

What are the most cited papers from Sinclair Community College?

The most cited paper from Sinclair Community College is "The Future of Sensitivity Analysis: An essential discipline for systems modeling and policy support" (Saman Razavi et al., 2020), with 629 citations. Next come "Essentials of Local Anesthetic Pharmacology" (389) and "Eyewitness accuracy rates in sequential and simultaneous lineup presentations: A meta-analytic comparison." (314).

Most cited papers
#PaperReleasedCitations
1 The Future of Sensitivity Analysis: An essential discipline for systems modeling and policy support Saman Razavi et al. · Environmental Modelling & Software Open access 16 Dec 2020 629
2 Essentials of Local Anesthetic Pharmacology Daniel E. Becker, Kenneth L. Reed · Anesthesia Progress Open access Sep 2006 389
3 Eyewitness accuracy rates in sequential and simultaneous lineup presentations: A meta-analytic comparison. Nancy K. Steblay, Jennifer E. Dysart, Solomon M. Fulero et al. · Law and Human Behavior Oct 2001 314
4 Evidence and Recommendations on the Use of Telemedicine for the Management of Arterial Hypertension Stefano Omboni, Richard J. McManus, Hayden Barry Bosworth et al. · Hypertension Open access 14 Sep 2020 307
5 Internet-Enabled Interactive Multimedia Asthma Education Program: A Randomized Trial Santosh Krishna, Benjamin David Francisco, E. Andrew Balas et al. · PEDIATRICS Mar 2003 283
All 61 most cited papers, with filters and sorting

Which keywords describe research at Sinclair Community College?

By fractional works in 2022-now, weighted toward what it does more of than the world: Social Justice, Community Engagement, Identity, Gender, Education, Neoliberalism, Sustainable Development and Nationalism.

▲ more of its work than of the world's◆ about the world's share▼ less than the world's

Size is fractional works in 2022-now in the topics tagged with each word; colour is the word's share of this institution's work against its share of the world's. The 22 words are chosen for being large and distinctive. Each links to the topic it comes from most.

All 22 words, with their numbers
  1. Social Justice2▲ 11×6 topics
  2. Education2▲ 3.8×9 topics
  3. Sustainable Development2▲ 3.9×4 topics
  4. Community Engagement2▲ 18×5 topics
  5. Globalization2▲ 2.8×7 topics
  6. Identity2▲ 7.7×6 topics
  7. Gender2▲ 9.2×5 topics
  8. Sustainability2▲ 2.1×6 topics
  9. Neoliberalism2▲ 13×4 topics
  10. Literature1▲ 6.8×4 topics
  11. Nationalism1▲ 8.3×2 topics
  12. Colonialism1▲ 6.8×3 topics
  13. Public Policy1▲ 6.8×2 topics
  14. Race1▲ 27×3 topics
  15. Simulation1▲ 13×3 topics
  16. American founding1▲ 101×1 topic
  17. Constitutional government1▲ 101×1 topic
  18. Cultural Capital1▲ 46×1 topic
  19. Environmental Participation1▲ 39×1 topic
  20. Epidemiology1▼ 0.72×5 topics
  21. Social Class1▲ 216×1 topic
  22. Territorial Governance1▲ 24×1 topic

Which research topics does Sinclair Community College publish most on?

By volume in 2022-now: Social and Cultural Dynamics, French Urban and Social Studies, American Constitutional Law and Politics and Community Development and Social Impact.

  1. 1 Social and Cultural Dynamics Sociology and Political Science 1 works
  2. 2 French Urban and Social Studies Sociology and Political Science 1 works
  3. 3 American Constitutional Law and Politics Political Science and International Relations 1 works
  4. 4 Community Development and Social Impact Finance 1 works
  5. 5 Focus Groups and Qualitative Methods Sociology and Political Science 0 works
  6. 6 Latin American history and culture Visual Arts and Performing Arts 0 works
  7. 7 Historical Studies in Latin America Demography 0 works
  8. 8 Anthropological Studies and Insights Anthropology 0 works
  9. 9 Simulation-Based Education in Healthcare Physiology 0 works
  10. 10 Race, Genetics, and Society Genetics 0 works

How open and international is its research?

Against the world's own shares: the tick on each track. Both are shares of its output, so they sit on one scale and can be read against each other as well as against the world.

openly available22.3%not open77.7%

World: 40% of research is openly available.

with international co-authors10.4%domestic only89.6%

World: 18% is written across borders.

How has Sinclair Community College's research output changed?

Output in 2022-2025 was 43% lower than in 2018-2021.

still counting1990200020102020
grewheldshrank

The same series as a ribbon: one cell per year, darker for more. The line above answers how much; this answers when.

Its share of all research

Growing output can still be a shrinking share: all of science grows. This is Sinclair Community College as a percentage of every work published that year, 0.00010% in 2024.

still counting0.00050%0.0010%0.0015%Sinclair Community College0.00030% in 202519801990200020102020

Fractional works of Sinclair Community College over all fractional works that year. How the balance of science has shifted.

Other research institutions in Dayton

All research institutions in Dayton

Share Sinclair Community College's ranking
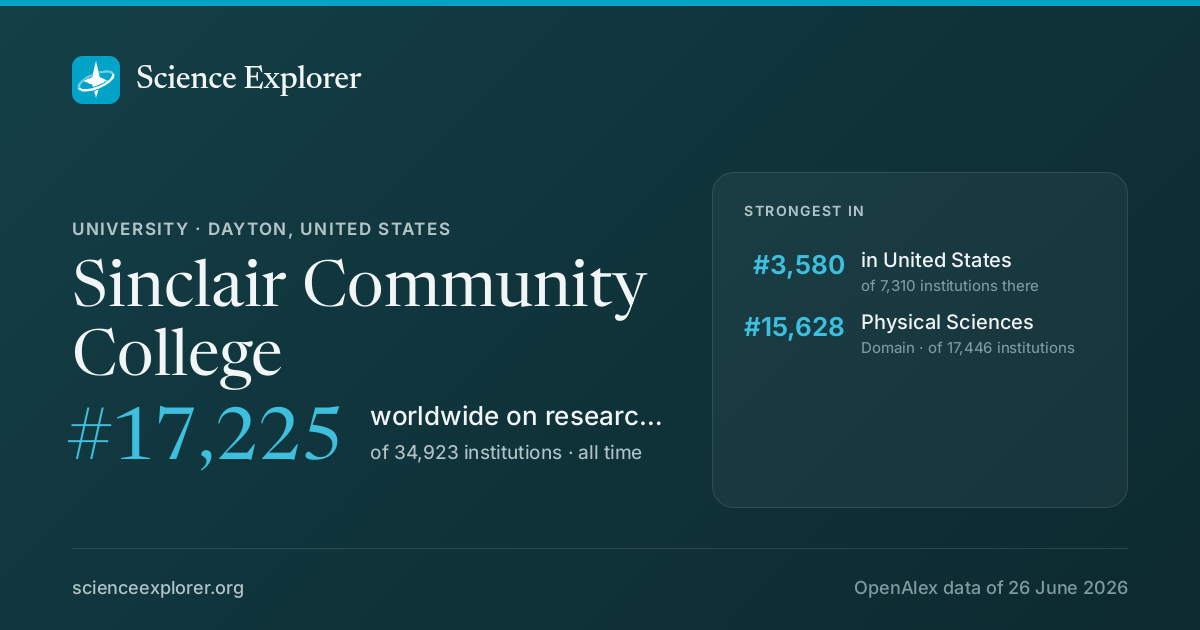
Sinclair Community College on Science Explorer

A card with Sinclair Community College's standing and the fields it leads in, for a post or a slide. A link to this page previews as the same card.

Download the card

1200 × 630 PNG, sized for social posts, drawn from the latest snapshot.

Badges for a website1Each links back here and updates with every snapshot

Research measures only: rankings here say nothing about teaching, admissions or student experience. Comparable institutions and collaboration partners have tabs of their own, above.

Discussion

Ask a question or share a note about Sinclair Community College. Posts are plain text and can be reported.