Each strip is that field's whole ranked pool, with the notch where Environmental Education Exchange sits in it, in the colour
of the band that rank falls in. The track under the rate is the rate itself: it carries no average mark, because the average
differs by field (from about 6% in Dentistry to 21% in Economics).
Which fields of science does Environmental Education Exchange work in?
Life Sciences7%Physical Sciences36%Health Sciences34%Social Sciences23%
Each ring splits the one inside it: the four domains of science, their fields, their subfields. Size is fractional works in 2022-now. Every slice is a page; the interactive view zooms down to single topics and colours each by how much more of it this institution does than the world.
Location quotient across every field it publishes in: outside the ring is more than an institution of this size would be expected to publish, inside it is less.
more than its size predictsabout as predictedless
Rings at 0.5×, 1× and 2×. Widest outward: Nursing, 6.0×. Every wedge is a field page.
All 24 fields, with their numbers
Nursing6.01×1 works
Psychology3.09×3 works
Health Professions2.15×2 works
Economics, Econometrics and Finance1.99×1 works
Environmental Science1.89×3 works
Neuroscience1.61×1 works
Pharmacology, Toxicology and Pharmaceutics1.49×0 works
Medicine1.32×9 works
Engineering1.17×6 works
Earth and Planetary Sciences1.00×0 works
Arts and Humanities0.93×1 works
Business, Management and Accounting0.76×1 works
Physics and Astronomy0.69×0 works
Immunology and Microbiology0.57×0 works
Computer Science0.55×1 works
Energy0.53×0 works
Biochemistry, Genetics and Molecular Biology0.47×1 works
What are the most cited papers from Environmental Education Exchange?
The most cited paper from Environmental Education Exchange is "The B73 Maize Genome: Complexity, Diversity, and Dynamics" (Patrick S. Schnable et al., 2009), with 4,265 citations. Next come "Effects of common ophthalmic preservatives on ocular health" (304) and "What happens when n= 1000? Creating large-n geochronological datasets with LA-ICP-MS for geologic investigations" (236).
Which keywords describe research at Environmental Education Exchange?
By fractional works in 2022-now, weighted toward what it does more of than the world: Primary Care, Public Health, Health Care Spending, Insurance Markets, Media, Health Policy, Information Science and Nursing Advocacy.
▲ more of its work than of the world's◆ about the world's share▼ less than the world's
Size is fractional works in 2022-now in the topics tagged with each word; colour is the word's share of this institution's work against its share of the world's. The 15 words are chosen for being large and distinctive. Each links to the topic it comes from most.
All 15 words, with their numbers
Public Health2▲ 4.1×8 topics
Primary Care2▲ 13×2 topics
Climate Change2▲ 1.61×10 topics
Renewable Energy2▲ 3.0×10 topics
Remote Sensing1▲ 3.3×7 topics
Health Care Spending1▲ 100×1 topic
Insurance Markets1▲ 100×1 topic
Media1▲ 23×2 topics
Mental Health1▲ 2.2×5 topics
Meta-Analysis1▲ 5.7×6 topics
Epidemiology1▼ 0.74×13 topics
Health Policy1▲ 19×1 topic
Information Science1▲ 128×1 topic
Nursing Advocacy1▲ 312×1 topic
Technology1▲ 5.6×1 topic
Which research topics does Environmental Education Exchange publish most on?
Against the world's own shares: the tick on each track. Both are shares of its output, so they
sit on one scale and can be read against each other as well as against the world.
24%76%
openly available24.4%not open75.6%
World: 40% of research is openly available.
16%84%
with international co-authors16.1%domestic only83.9%
World: 18% is written across borders.
How has Environmental Education Exchange's research output changed?
Output in 2022-2025 was 0% higher than in 2018-2021.
grewheldshrank
The same series as a ribbon: one cell per year, darker for more. The line above answers how much; this answers when.
Its share of all research
Growing output can still be a shrinking share: all of science grows. This is Environmental Education Exchange as a percentage of every work published that year, 0.00025% in 2024.
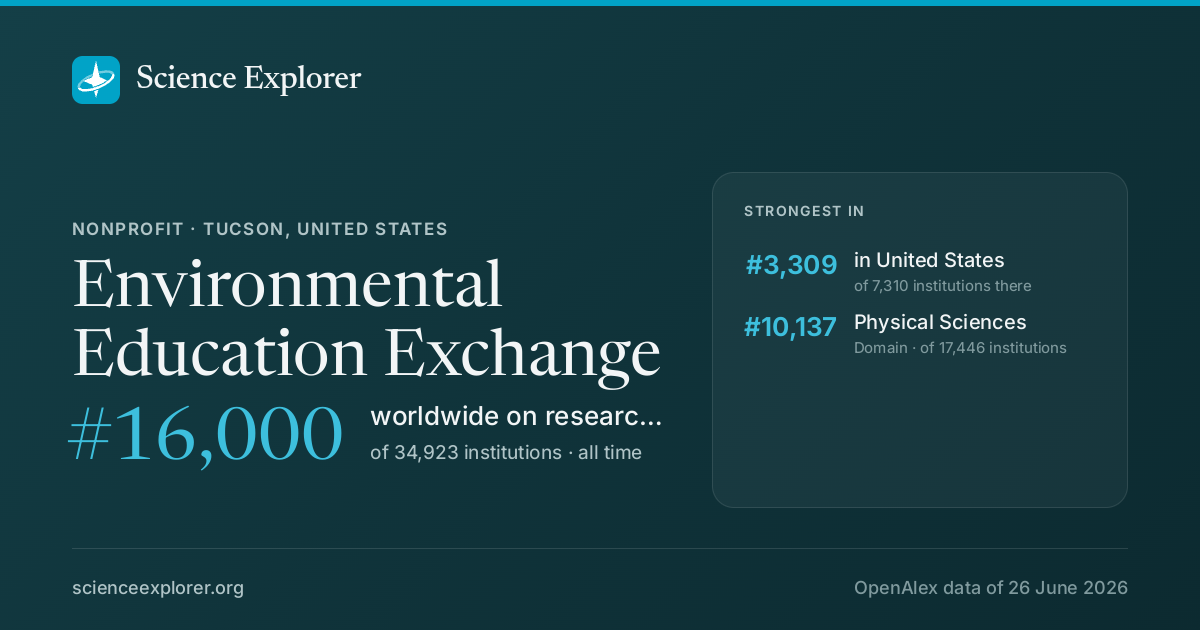
A card with Environmental Education Exchange's standing and the fields it leads in, for a post or a slide. A link to this page previews as the same card.
Research measures only: rankings here say nothing about teaching, admissions or student experience. Comparable institutions and collaboration partners have tabs of their own, above.
Discussion
Ask a question or share a note about Environmental Education Exchange. Posts are plain text and can be reported.
 United States · #2,991,434 worldwide
286 citations · 21 works