Science Explorer Back to mapMap
Discussion
Company · Tucson · United States

Vector (United States)

In research, Vector (United States) stands highest in Life Sciences (#3,154 of 11,023 worldwide), Health Sciences (#5,128 of 16,688 worldwide) and Physical Sciences (#6,820 of 17,446 worldwide), over all time.

World rank, 2022-now
#13,065
of 22,385 · #6,254 all time
Rank in United States
#1,833
of 3,332
Research works
603
▼ 13% vs 2018-21
Citations
15k
25.6 per fractional work
Top-10% rate
12.9%
all institutions 10.0%
vs its own fields
1.05×
1.00× is exactly expected
Open access
49%
world 40%
International
39%
world 18%

What is Vector (United States) known for in research?

The fields where it stands highest, over all time, ranked among every institution above the floor in each field.

FieldWorld rankWhere that sitsTop-10% rateWorks
Life SciencesDomain #3,154 of 11,023 15.7%162
Health SciencesDomain #5,128 of 16,688 14.1%179
Physical SciencesDomain #6,820 of 17,446 9.6%204
MedicineField #5,708 of 14,558 14.3%169

Each strip is that field's whole ranked pool, with the notch where Vector (United States) sits in it, in the colour of the band that rank falls in. The track under the rate is the rate itself: it carries no average mark, because the average differs by field (from about 6% in Dentistry to 21% in Economics).

Which fields of science does Vector (United States) work in?

In 2022-now, 38% of research at Vector (United States) is in Health Sciences, 32% in Life Sciences. Its largest fields are Medicine (36%), Biochemistry, Genetics and Molecular Biology (12%), Agricultural and Biological Sciences (10%). It does 2.2× the world's share of Life Sciences.

Health Sciences: 45 fractional works · 38.0% of its workMedicine: 43 fractional works · 36.1% of its workPublic Health, Environmental and Occupational Health: 16 fractional works · 13.2% of its workInfectious Diseases: 7 fractional works · 5.9% of its workEpidemiology: 4 fractional works · 3.8% of its workOncology: 2 fractional works · 1.9% of its workPsychiatry and Mental health: 2 fractional works · 1.9% of its workPhysiology: 1 fractional works · 1.3% of its workPulmonary and Respiratory Medicine: 1 fractional works · 1.0% of its workSurgery: 1 fractional works · 1.0% of its workNeurology: 1 fractional works · 0.9% of its workPathology and Forensic Medicine: 1 fractional works · 0.8% of its workPediatrics, Perinatology and Child Health: 1 fractional works · 0.8% of its workPharmacology: 1 fractional works · 0.5% of its workRadiology, Nuclear Medicine and Imaging: 1 fractional works · 0.5% of its workRheumatology: 0 fractional works · 0.4% of its workCardiology and Cardiovascular Medicine: 0 fractional works · 0.3% of its workHematology: 0 fractional works · 0.3% of its workEndocrinology, Diabetes and Metabolism: 0 fractional works · 0.3% of its workGenetics: 0 fractional works · 0.3% of its workSmaller subfields together: 1 fractional works · 1.1% of its workHealth Professions: 1 fractional works · 1.2% of its workGeneral Health Professions: 1 fractional works · 0.8% of its workSpeech and Hearing: 0 fractional works · 0.2% of its workSmaller subfields together: 0 fractional works · 0.2% of its workVeterinary: 1 fractional works · 0.4% of its workSmall Animals: 0 fractional works · 0.3% of its workSmaller subfields together: 0 fractional works · 0.1% of its workDentistry: 0 fractional works · 0.2% of its workNursing: 0 fractional works · 0.1% of its workLife Sciences: 38 fractional works · 31.6% of its workBiochemistry, Genetics and Molecular Biology: 15 fractional works · 12.3% of its workMolecular Biology: 9 fractional works · 7.5% of its workGenetics: 4 fractional works · 3.1% of its workCancer Research: 1 fractional works · 0.8% of its workBiotechnology: 0 fractional works · 0.3% of its workSmaller subfields together: 1 fractional works · 0.6% of its workAgricultural and Biological Sciences: 12 fractional works · 10.0% of its workInsect Science: 4 fractional works · 3.7% of its workEcology, Evolution, Behavior and Systematics: 3 fractional works · 2.9% of its workPlant Science: 3 fractional works · 2.6% of its workFood Science: 1 fractional works · 0.5% of its workSmaller subfields together: 0 fractional works · 0.3% of its workImmunology and Microbiology: 9 fractional works · 7.9% of its workParasitology: 6 fractional works · 4.9% of its workImmunology: 3 fractional works · 2.7% of its workSmaller subfields together: 0 fractional works · 0.2% of its workNeuroscience: 1 fractional works · 0.8% of its workCellular and Molecular Neuroscience: 1 fractional works · 0.5% of its workNeurology: 0 fractional works · 0.3% of its workSmaller subfields together: 0 fractional works · 0.0% of its workPharmacology, Toxicology and Pharmaceutics: 1 fractional works · 0.7% of its workPharmacology: 1 fractional works · 0.6% of its workSmaller subfields together: 0 fractional works · 0.2% of its workPhysical Sciences: 23 fractional works · 19.6% of its workEngineering: 5 fractional works · 4.3% of its workBiomedical Engineering: 1 fractional works · 1.1% of its workMechanical Engineering: 1 fractional works · 0.8% of its workAerospace Engineering: 1 fractional works · 0.5% of its workElectrical and Electronic Engineering: 1 fractional works · 0.5% of its workCivil and Structural Engineering: 0 fractional works · 0.3% of its workControl and Systems Engineering: 0 fractional works · 0.3% of its workMechanics of Materials: 0 fractional works · 0.3% of its workSmaller subfields together: 1 fractional works · 0.6% of its workComputer Science: 5 fractional works · 4.3% of its workArtificial Intelligence: 2 fractional works · 1.9% of its workInformation Systems: 1 fractional works · 0.8% of its workSoftware: 1 fractional works · 0.5% of its workHardware and Architecture: 1 fractional works · 0.4% of its workComputer Networks and Communications: 0 fractional works · 0.4% of its workSmaller subfields together: 0 fractional works · 0.2% of its workEnvironmental Science: 5 fractional works · 3.9% of its workWater Science and Technology: 1 fractional works · 1.2% of its workEcology: 1 fractional works · 0.8% of its workGlobal and Planetary Change: 1 fractional works · 0.6% of its workHealth, Toxicology and Mutagenesis: 1 fractional works · 0.6% of its workEcological Modeling: 1 fractional works · 0.4% of its workPollution: 0 fractional works · 0.3% of its workPhysics and Astronomy: 2 fractional works · 2.0% of its workAtomic and Molecular Physics, and Optics: 2 fractional works · 1.5% of its workAstronomy and Astrophysics: 0 fractional works · 0.4% of its workSmaller subfields together: 0 fractional works · 0.1% of its workChemistry: 2 fractional works · 1.8% of its workOrganic Chemistry: 2 fractional works · 1.4% of its workAnalytical Chemistry: 0 fractional works · 0.3% of its workSmaller subfields together: 0 fractional works · 0.1% of its workMathematics: 2 fractional works · 1.7% of its workStatistics and Probability: 2 fractional works · 1.4% of its workModeling and Simulation: 0 fractional works · 0.3% of its workEnergy: 1 fractional works · 0.8% of its workRenewable Energy, Sustainability and the Environment: 1 fractional works · 0.8% of its workEarth and Planetary Sciences: 1 fractional works · 0.6% of its workMaterials Science: 0 fractional works · 0.3% of its workMaterials Chemistry: 0 fractional works · 0.3% of its workSocial Sciences: 13 fractional works · 10.8% of its workSocial Sciences: 6 fractional works · 4.8% of its workSociology and Political Science: 2 fractional works · 1.5% of its workDemography: 1 fractional works · 0.8% of its workEducation: 1 fractional works · 0.7% of its workHealth: 1 fractional works · 0.6% of its workAnthropology: 0 fractional works · 0.3% of its workLaw: 0 fractional works · 0.3% of its workPolitical Science and International Relations: 0 fractional works · 0.3% of its workGender Studies: 0 fractional works · 0.2% of its workSmaller subfields together: 0 fractional works · 0.1% of its workDecision Sciences: 3 fractional works · 2.6% of its workInformation Systems and Management: 1 fractional works · 0.9% of its workStatistics, Probability and Uncertainty: 1 fractional works · 0.9% of its workManagement Science and Operations Research: 1 fractional works · 0.8% of its workPsychology: 1 fractional works · 1.2% of its workClinical Psychology: 1 fractional works · 0.5% of its workExperimental and Cognitive Psychology: 0 fractional works · 0.4% of its workSmaller subfields together: 0 fractional works · 0.3% of its workBusiness, Management and Accounting: 1 fractional works · 1.2% of its workStrategy and Management: 1 fractional works · 0.6% of its workBusiness and International Management: 0 fractional works · 0.3% of its workManagement of Technology and Innovation: 0 fractional works · 0.3% of its workSmaller subfields together: 0 fractional works · 0.1% of its workEconomics, Econometrics and Finance: 1 fractional works · 0.7% of its workEconomics and Econometrics: 1 fractional works · 0.7% of its workArts and Humanities: 0 fractional works · 0.2% of its workALL ITS WORKVector (UnitedStates)119fractional works, 2022-now
Life Sciences32%Physical Sciences20%Health Sciences38%Social Sciences11%

Each ring splits the one inside it: the four domains of science, their fields, their subfields. Size is fractional works in 2022-now. Every slice is a page; the interactive view zooms down to single topics and colours each by how much more of it this institution does than the world.

Its 4 domains and 25 fields, with their numbers
    1. Medicine4336.1%
    2. Health Professions11.2%
    3. Veterinary10.4%
    4. Dentistry00.2%
    5. Nursing00.1%
    1. Biochemistry, Genetics and Molecular Biology1512.3%
    2. Agricultural and Biological Sciences1210.0%
    3. Immunology and Microbiology97.9%
    4. Neuroscience10.8%
    5. Pharmacology, Toxicology and Pharmaceutics10.7%
    1. Engineering54.3%
    2. Computer Science54.3%
    3. Environmental Science53.9%
    4. Physics and Astronomy22.0%
    5. Chemistry21.8%
    6. Mathematics21.7%
    7. Energy10.8%
    8. Earth and Planetary Sciences10.6%
    9. Materials Science00.3%
    1. Social Sciences64.8%
    2. Decision Sciences32.6%
    3. Psychology11.2%
    4. Business, Management and Accounting11.2%
    5. Economics, Econometrics and Finance10.7%
    6. Arts and Humanities00.2%
All of science, and how each field's share has moved since 1950: the Science domain explorer

Field profile

Location quotient across every field it publishes in: outside the ring is more than an institution of this size would be expected to publish, inside it is less.

Agricultural and Biological Sciences: 2.10× its world share, 12 worksAgricultural and Bio…Biochemistry, Genetics and Molecular Biology: 2.30× its world share, 15 worksBiochemistry, Geneti…Immunology and Microbiology: 7.81× its world share, 9 worksImmunology and Micro…Neuroscience: 0.49× its world share, 1 worksNeurosciencePharmacology, Toxicology and Pharmaceutics: 2.05× its world share, 1 worksPharmacology, Toxico…Chemistry: 1.13× its world share, 2 worksChemistryComputer Science: 0.55× its world share, 5 worksComputer ScienceEarth and Planetary Sciences: 0.36× its world share, 1 worksEarth and Planetary …Energy: 0.92× its world share, 1 worksEnergyEngineering: 0.29× its world share, 5 worksEngineeringEnvironmental Science: 0.78× its world share, 5 worksEnvironmental ScienceMaterials Science: 0.08× its world share, 0 worksMaterials ScienceMathematics: 1.42× its world share, 2 worksMathematicsPhysics and Astronomy: 0.90× its world share, 2 worksPhysics and AstronomyDentistry: 0.39× its world share, 0 worksDentistryHealth Professions: 0.44× its world share, 1 worksHealth ProfessionsMedicine: 1.88× its world share, 43 worksMedicineNursing: 0.26× its world share, 0 worksNursingVeterinary: 3.26× its world share, 0 worksVeterinaryArts and Humanities: 0.07× its world share, 0 worksArts and HumanitiesBusiness, Management and Accounting: 0.38× its world share, 1 worksBusiness, Management…Decision Sciences: 2.65× its world share, 3 worksDecision SciencesEconomics, Econometrics and Finance: 0.34× its world share, 1 worksEconomics, Econometr…Psychology: 0.41× its world share, 2 worksPsychologySocial Sciences: 0.38× its world share, 6 worksSocial Sciences1×world share
more than its size predictsabout as predictedless

Rings at 0.5×, 1× and 2×. Widest outward: Immunology and Microbiology, 7.8×. Every wedge is a field page.

All 25 fields, with their numbers
  1. Immunology and Microbiology7.81×9 works
  2. Veterinary3.26×0 works
  3. Decision Sciences2.65×3 works
  4. Biochemistry, Genetics and Molecular Biology2.30×15 works
  5. Agricultural and Biological Sciences2.10×12 works
  6. Pharmacology, Toxicology and Pharmaceutics2.05×1 works
  7. Medicine1.88×43 works
  8. Mathematics1.42×2 works
  9. Chemistry1.13×2 works
  10. Energy0.92×1 works
  11. Physics and Astronomy0.90×2 works
  12. Environmental Science0.78×5 works
  13. Computer Science0.55×5 works
  14. Neuroscience0.49×1 works
  15. Health Professions0.44×1 works
  16. Psychology0.41×2 works
  17. Dentistry0.39×0 works
  18. Business, Management and Accounting0.38×1 works
  19. Social Sciences0.38×6 works
  20. Earth and Planetary Sciences0.36×1 works
  21. Economics, Econometrics and Finance0.34×1 works
  22. Engineering0.29×5 works
  23. Nursing0.26×0 works
  24. Materials Science0.08×0 works
  25. Arts and Humanities0.07×0 works

Who are the top researchers at Vector (United States)?

Ranked on the quality score, Christof Ebert, Carrie R. Houts and Robert J. Wirth lead among researchers whose main affiliation is Vector (United States).

  1. 1 Christof Ebert United States · #529,437 worldwide 6.3k citations · 306 works
  2. 2 Carrie R. Houts United States · #790,617 worldwide 1.8k citations · 60 works
  3. 3 Robert J. Wirth United States · #950,825 worldwide 4.9k citations · 135 works
  4. 4 James S. McGinley United States · #1,188,270 worldwide 1.4k citations · 53 works
  5. 5 Susanne Kluh United States · #1,309,593 worldwide 805 citations · 18 works
  6. 6 Nikos Gurfield United States · #1,425,567 worldwide 2k citations · 31 works
  7. 7 Jenny S. Carlson United States · #1,682,218 worldwide 983 citations · 50 works
  8. 8 Angela Caranci United States · #3,451,909 worldwide 216 citations · 24 works
  9. 9 Peter F. Drake United States · #3,508,607 worldwide 540 citations · 28 works
  10. 10 Claude S. Lineberry United States · #4,482,078 worldwide 29 citations · 16 works
All ranked researchers at Vector (United States)

What are the most cited papers from Vector (United States)?

The most cited paper from Vector (United States) is "The Global Burden of Nontyphoidal Salmonella Gastroenteritis" (Shannon Elizabeth Majowicz, Jennie Musto, Elaine Scallan et al., 2010), with 2,497 citations. Next come "An amplicon-based sequencing framework for accurately measuring intrahost virus diversity using PrimalSeq and iVar" (1,191) and "NATURAL HISTORY OF PLAGUE: Perspectives from More than a Century of Research" (737).

Most cited papers
#PaperReleasedCitations
1 The Global Burden of Nontyphoidal Salmonella Gastroenteritis Shannon Elizabeth Majowicz, Jennie Musto, Elaine Scallan et al. · Clinical Infectious Diseases 16 Feb 2010 2,497
2 An amplicon-based sequencing framework for accurately measuring intrahost virus diversity using PrimalSeq and iVar Nathan D. Grubaugh, Karthik Gangavarapu, Joshua C Quick et al. · Genome biology Open access 8 Jan 2019 1,191
3 NATURAL HISTORY OF PLAGUE: Perspectives from More than a Century of Research Kenneth L. Gage, Michael Kosoy · Annual Review of Entomology Review 2 Nov 2004 737
4 “Bird biting” mosquitoes and human disease: A review of the role of Culex pipiens complex mosquitoes in epidemiology Ary Farajollahi, Dina M. Fonseca, Laura D. Kramer et al. · Infection Genetics and Evolution Open access 22 Aug 2011 679
5 Ross, Macdonald, and a Theory for the Dynamics and Control of Mosquito-Transmitted Pathogens David L. Smith, Katherine E. Battle, Simon Iain Hay et al. · PLoS Pathogens Open access 5 Apr 2012 666
All 60 most cited papers, with filters and sorting

Which keywords describe research at Vector (United States)?

By fractional works in 2022-now, weighted toward what it does more of than the world: Epidemiology, Vaccine Development, Vector Control, Public Health, Arboviral Diseases, Zika Virus, Pathogenesis and Host-Pathogen Interactions.

▲ more of its work than of the world's◆ about the world's share▼ less than the world's

Size is fractional works in 2022-now in the topics tagged with each word; colour is the word's share of this institution's work against its share of the world's. The 40 words are chosen for being large and distinctive. Each links to the topic it comes from most.

All 40 words, with their numbers
  1. Epidemiology31▲ 6.5×49 topics
  2. Vaccine Development14▲ 45×5 topics
  3. Vector Control12▲ 84×4 topics
  4. Public Health10▲ 5.5×13 topics
  5. Arboviral Diseases8▲ 101×1 topic
  6. Zika Virus8▲ 101×1 topic
  7. Pathogenesis7▲ 12×10 topics
  8. Host-Pathogen Interactions6▲ 60×3 topics
  9. Global Burden6▲ 8.7×6 topics
  10. Genome Sequence6▲ 56×2 topics
  11. Insecticide Resistance6▲ 58×4 topics
  12. Climate Change5▲ 1.51×15 topics
  13. Pathogen Transmission5▲ 57×3 topics
  14. Genetic Diversity4▲ 8.8×6 topics
  15. Zoonotic Infections4▲ 69×2 topics
  16. Drug Resistance4▲ 13×6 topics
  17. Artemisinin Resistance4▲ 106×1 topic
  18. Plasmodium falciparum4▲ 106×1 topic
  19. Bunyavirus4▲ 77×1 topic
  20. Viral Hemorrhagic Fevers4▲ 77×1 topic
  21. Lyme Disease4▲ 128×1 topic
  22. Tick-Borne Diseases4▲ 128×1 topic
  23. Treatment4▲ 2.5×11 topics
  24. Immune Response4▲ 5.4×13 topics
  25. Microbiota3▲ 13×3 topics
  26. Biodiversity3▲ 3.4×6 topics
  27. Immunity3▲ 5.6×5 topics
  28. Neurological Disorders3▲ 3.9×7 topics
  29. Vaccine3▲ 5.8×8 topics
  30. Chemotherapy3▲ 3.1×8 topics
  31. Genome Evolution2▲ 47×2 topics
  32. Symbiont2▲ 94×1 topic
  33. Wolbachia2▲ 94×1 topic
  34. Genomics2▲ 5.9×8 topics
  35. Helminth Infections2▲ 41×2 topics
  36. Drosophila2▲ 34×2 topics
  37. Headache Disorders2▲ 62×1 topic
  38. Migraine2▲ 36×1 topic
  39. Immune Regulation2▲ 13×3 topics
  40. Leishmaniasis2▲ 70×1 topic

Which research topics does Vector (United States) publish most on?

By volume in 2022-now: Mosquito-borne diseases and control, Malaria Research and Control, Viral Infections and Vectors and Vector-borne infectious diseases.

  1. 1 Mosquito-borne diseases and control Public Health, Environmental and Occupational Health 8 works
  2. 2 Malaria Research and Control Public Health, Environmental and Occupational Health 4 works
  3. 3 Viral Infections and Vectors Infectious Diseases 4 works
  4. 4 Vector-borne infectious diseases Parasitology 4 works
  5. 5 Insect symbiosis and bacterial influences Insect Science 2 works
  6. 6 Migraine and Headache Studies Psychiatry and Mental health 2 works
  7. 7 Research on Leishmaniasis Studies Public Health, Environmental and Occupational Health 2 works
  8. 8 Parasites and Host Interactions Parasitology 1 works
  9. 9 Trypanosoma species research and implications Epidemiology 1 works
  10. 10 Invertebrate Immune Response Mechanisms Immunology 1 works

How open and international is its research?

Against the world's own shares: the tick on each track. Both are shares of its output, so they sit on one scale and can be read against each other as well as against the world.

openly available48.7%not open51.3%

World: 40% of research is openly available.

with international co-authors39.0%domestic only61.0%

World: 18% is written across borders.

How has Vector (United States)'s research output changed?

Output in 2022-2025 was 13% lower than in 2018-2021.

still counting1990200020102020
grewheldshrank

The same series as a ribbon: one cell per year, darker for more. The line above answers how much; this answers when.

Its share of all research

Growing output can still be a shrinking share: all of science grows. This is Vector (United States) as a percentage of every work published that year, 0.00047% in 2024.

still counting0.0010%0.0020%Vector (United States)0.00047% in 202519801990200020102020

Fractional works of Vector (United States) over all fractional works that year. How the balance of science has shifted.

How much of it reaches the world top 10%

Year by year, against all institutions in the same year.

still counting10%20%30%Vector (United States)12.8% in 2025all institutions10.0% in 20252020

Of each year's output, the share that reached the world's 10% most cited for its field and year. Peak 22.9% in 2014.

Other research institutions in Tucson

All research institutions in Tucson

Share Vector (United States)'s ranking
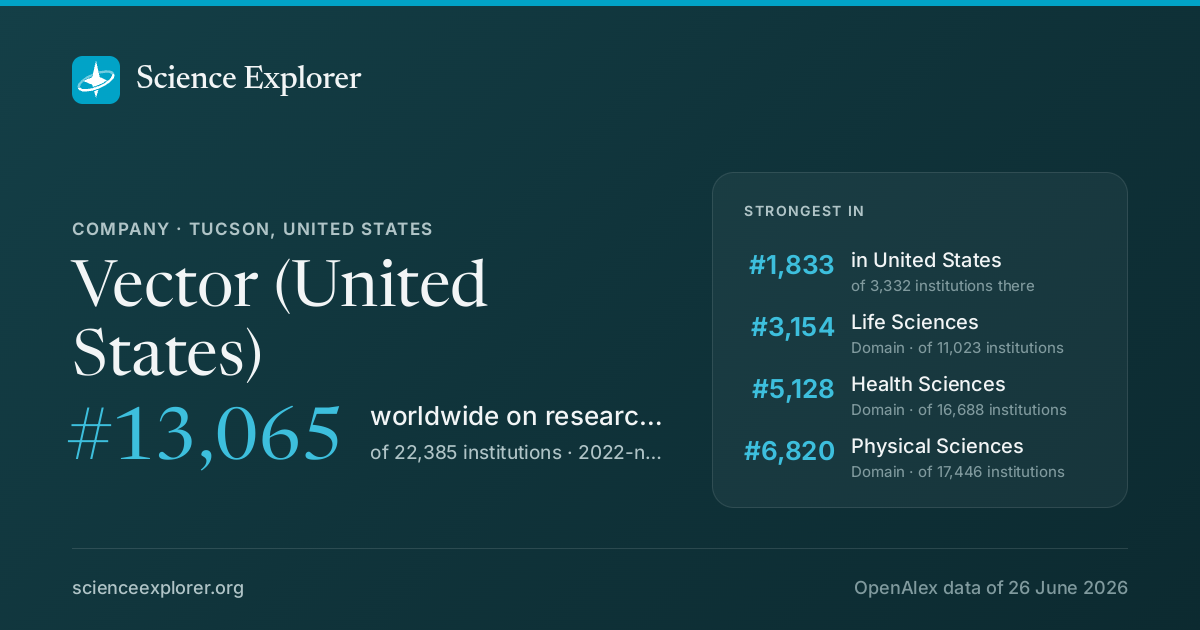
Vector (United States) on Science Explorer

A card with Vector (United States)'s standing and the fields it leads in, for a post or a slide. A link to this page previews as the same card.

Download the card

1200 × 630 PNG, sized for social posts, drawn from the latest snapshot.

Badges for a website1Each links back here and updates with every snapshot

Research measures only: rankings here say nothing about teaching, admissions or student experience. Comparable institutions and collaboration partners have tabs of their own, above.

Discussion

Ask a question or share a note about Vector (United States). Posts are plain text and can be reported.