Flow Analysis (United States)
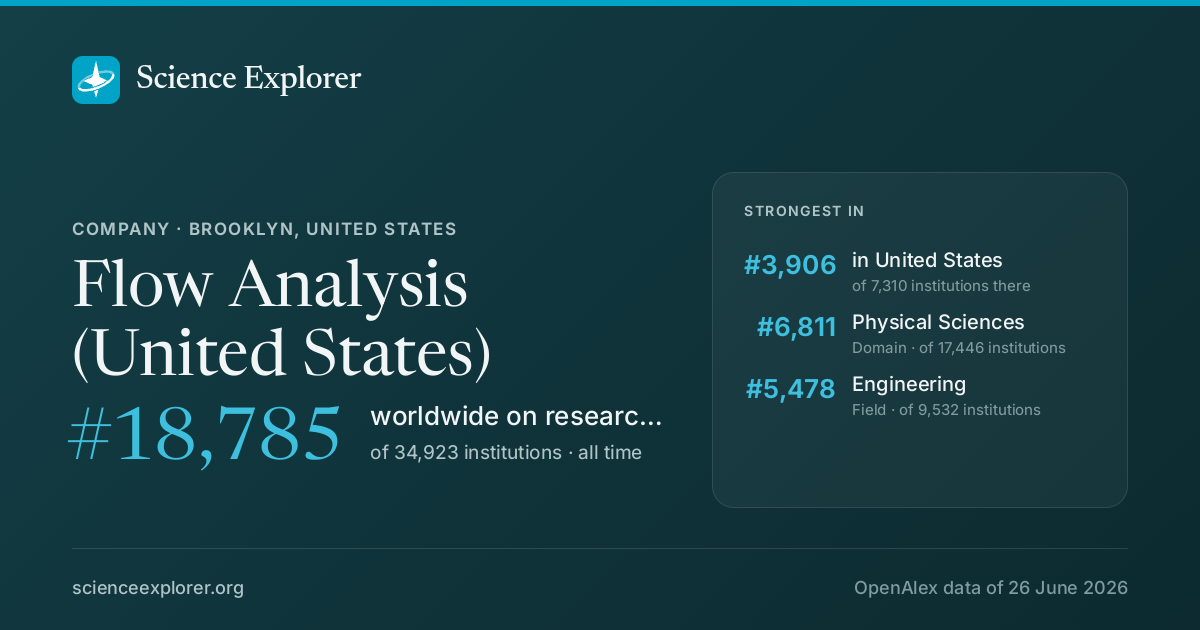
In research, Flow Analysis (United States) stands highest in Physical Sciences (#6,811 of 17,446 worldwide) and Engineering (#5,478 of 9,532 worldwide), over all time.
- World rank, all time
- #18,785 of 34,923
- Rank in United States
- #3,906 of 7,310
- Research works
- 328 ▲ 89% vs 2018-21
- Citations
- 8.1k 24.7 per fractional work
- Top-10% rate
- 12.1% all institutions 10.0%
- vs its own fields
- 0.91× 1.00× is exactly expected
- Open access
- 38% world 40%
- International
- 28% world 18%
What is Flow Analysis (United States) known for in research?
The fields where it stands highest, over all time, ranked among every institution above the floor in each field.
| Field | World rank | Where that sits | Top-10% rate | Works |
|---|---|---|---|---|
| Physical SciencesDomain | #6,811 of 17,446 | 14.0% | 243 | |
| EngineeringField | #5,478 of 9,532 | 14.6% | 162 |
Each strip is that field's whole ranked pool, with the notch where Flow Analysis (United States) sits in it, in the colour of the band that rank falls in. The track under the rate is the rate itself: it carries no average mark, because the average differs by field (from about 6% in Dentistry to 21% in Economics).
Which fields of science does Flow Analysis (United States) work in?
In 2022-now, 62% of research at Flow Analysis (United States) is in Physical Sciences, 15% in Health Sciences. Its largest fields are Engineering (34%), Medicine (12%), Environmental Science (9%). It does 1.5× the world's share of Physical Sciences.
Each ring splits the one inside it: the four domains of science, their fields, their subfields. Size is fractional works in 2022-now. Every slice is a page; the interactive view zooms down to single topics and colours each by how much more of it this institution does than the world.
Its 4 domains and 23 fields, with their numbers
- Physical Sciences4061.8%
- Engineering2234.2%
- Environmental Science69.3%
- Energy23.5%
- Computer Science23.5%
- Earth and Planetary Sciences23.4%
- Materials Science23.2%
- Physics and Astronomy12.0%
- Chemistry11.4%
- Chemical Engineering00.7%
- Mathematics00.5%
- Health Sciences914.7%
- Medicine812.2%
- Health Professions11.6%
- Nursing10.9%
- Social Sciences914.4%
- Social Sciences35.3%
- Psychology23.9%
- Arts and Humanities22.6%
- Decision Sciences11.5%
- Business, Management and Accounting11.1%
- Life Sciences69.1%
Field profile
Location quotient across every field it publishes in: outside the ring is more than an institution of this size would be expected to publish, inside it is less.
Rings at 0.5×, 1× and 2×. Widest outward: Energy, 3.9×. Every wedge is a field page.
All 23 fields, with their numbers
- Energy3.85×2 works
- Engineering2.28×22 works
- Earth and Planetary Sciences2.18×2 works
- Chemical Engineering2.09×0 works
- Environmental Science1.87×6 works
- Nursing1.77×1 works
- Decision Sciences1.59×1 works
- Psychology1.27×2 works
- Neuroscience1.11×1 works
- Agricultural and Biological Sciences0.92×3 works
- Materials Science0.92×2 works
- Physics and Astronomy0.92×1 works
- Arts and Humanities0.90×2 works
- Chemistry0.88×1 works
- Pharmacology, Toxicology and Pharmaceutics0.73×0 works
- Medicine0.63×8 works
- Health Professions0.61×1 works
- Immunology and Microbiology0.51×0 works
- Computer Science0.45×2 works
- Mathematics0.42×0 works
- Social Sciences0.42×3 works
- Biochemistry, Genetics and Molecular Biology0.40×1 works
- Business, Management and Accounting0.34×1 works
- Energy 3.9×
- Engineering 2.3×
- Earth and Planetary Sciences 2.2×
- Chemical Engineering 2.1×
- Environmental Science 1.9×
- Nursing 1.8×
- Decision Sciences 1.6×
- Psychology 1.3×
- Neuroscience 1.1×
- Agricultural and Biological Sciences 0.9×
- Materials Science 0.9×
- Physics and Astronomy 0.9×
- Arts and Humanities 0.9×
- Chemistry 0.9×
- Pharmacology, Toxicology and Pharmaceutics 0.7×
- Medicine 0.6×
- Health Professions 0.6×
- Immunology and Microbiology 0.5×
- Computer Science 0.5×
- Mathematics 0.4×
- Social Sciences 0.4×
- Biochemistry, Genetics and Molecular Biology 0.4×
- Business, Management and Accounting 0.3×
Who are the top researchers at Flow Analysis (United States)?
Ranked on the quality score, Dale M. Snider, William E. Dietz and P. Cherish lead among researchers whose main affiliation is Flow Analysis (United States).
- 1
Dale M. Snider
 United States · #389,742 worldwide
2.5k citations · 36 works
- 2
William E. Dietz
United States · #2,886,904 worldwide
501 citations · 35 works
- 3
P. Cherish
United States · #3,856,959 worldwide
8 citations · 15 works
- 4
Yonghu Wenren
United States · #4,198,743 worldwide
316 citations · 31 works
Which keywords describe research at Flow Analysis (United States)?
By fractional works in 2022-now, weighted toward what it does more of than the world: Sustainability, Heat Transfer, Community Participation, Biodiversity, landscape conservation, Satoyama, Vortex Dynamics and Renewable Energy.
- Sustainable Development
- Hydrodynamic Processes
- Reactive Transport
- Optimization
- Energy Efficiency
- Simulation
- Modeling
- Two-Phase Flow
- Numerical Modeling
- High-Speed Trains
- Crosswind
- Machine Learning
- Fluid Dynamics
- Climate Change
- Large-Eddy Simulation
- Vortex Dynamics
- Epidemiology
- Satoyama
- Renewable Energy
- Heat Transfer
- Sustainability
- Biodiversity
- Community Participation
- landscape conservation
- Numerical Simulation
- Aerodynamics
- Fluid-Structure Interaction
- Environmental Impact
- High-Performance Computing
- Sediment Transport
- Drag Reduction
- Turbulent Flows
- Turbulent Flow
- Architecture
- Nanoparticles
- Boundary Layer Transition
- History
- Particle Image Velocimetry
- Boundary Layer
- Shallow Water Flows
Size is fractional works in 2022-now in the topics tagged with each word; colour is the word's share of this institution's work against its share of the world's. The 40 words are chosen for being large and distinctive. Each links to the topic it comes from most.
All 40 words, with their numbers
- Sustainability6▲ 3.5×10 topics
- Heat Transfer4▲ 11×11 topics
- Biodiversity3▲ 6.4×2 topics
- Renewable Energy3▲ 3.4×17 topics
- Community Participation3▲ 13×2 topics
- Satoyama3▲ 461×1 topic
- landscape conservation3▲ 461×1 topic
- Epidemiology2◆ 0.87×15 topics
- Numerical Simulation2▲ 11×8 topics
- Vortex Dynamics2▲ 29×3 topics
- Aerodynamics2▲ 43×3 topics
- Large-Eddy Simulation2▲ 16×5 topics
- Fluid-Structure Interaction2▲ 17×4 topics
- Climate Change2▼ 0.84×12 topics
- Environmental Impact2▲ 1.36×3 topics
- Fluid Dynamics2▲ 16×5 topics
- High-Performance Computing2▲ 29×2 topics
- Machine Learning2▼ 0.69×8 topics
- Sediment Transport2▲ 15×5 topics
- Crosswind1▲ 75×1 topic
- Drag Reduction1▲ 50×2 topics
- High-Speed Trains1▲ 33×1 topic
- Turbulent Flows1▲ 23×3 topics
- Numerical Modeling1▲ 20×2 topics
- Turbulent Flow1▲ 17×4 topics
- Two-Phase Flow1▲ 27×3 topics
- Architecture1▲ 134×2 topics
- Modeling1▲ 7.6×2 topics
- Nanoparticles1▲ 1.50×8 topics
- Simulation1▲ 7.2×2 topics
- Boundary Layer Transition1▲ 25×1 topic
- Energy Efficiency1▲ 1.79×6 topics
- History1▲ 2.5×3 topics
- Optimization1▲ 3.9×3 topics
- Particle Image Velocimetry1▲ 25×1 topic
- Reactive Transport1▲ 32×2 topics
- Boundary Layer1▲ 12×4 topics
- Hydrodynamic Processes1▲ 152×1 topic
- Shallow Water Flows1▲ 152×1 topic
- Sustainable Development1◆ 0.99×3 topics
Which research topics does Flow Analysis (United States) publish most on?
By volume in 2022-now: Urban and spatial planning, Aerodynamics and Fluid Dynamics Research, Fluid Dynamics and Turbulent Flows and Aquatic and Environmental Studies.
Area is fractional works; colour is the subfield each topic belongs to.
- 1 Urban and spatial planning Nature and Landscape Conservation 3 works
- 2 Aerodynamics and Fluid Dynamics Research Aerospace Engineering 1 works
- 3 Fluid Dynamics and Turbulent Flows Computational Mechanics 1 works
- 4 Aquatic and Environmental Studies Earth-Surface Processes 1 works
- 5 Hydraulic and Pneumatic Systems Mechanical Engineering 1 works
- 6 CO2 Sequestration and Geologic Interactions Environmental Engineering 1 works
- 7 Engineering and Agricultural Innovations Aquatic Science 1 works
- 8 Architecture, Modernity, and Design Architecture 1 works
- 9 Flow Measurement and Analysis Mechanics of Materials 1 works
- 10 Reservoir Engineering and Simulation Methods Ocean Engineering 1 works
How open and international is its research?
Against the world's own shares: the tick on each track. Both are shares of its output, so they sit on one scale and can be read against each other as well as against the world.
World: 40% of research is openly available.
World: 18% is written across borders.
How has Flow Analysis (United States)'s research output changed?
Output in 2022-2025 was 89% higher than in 2018-2021.
The same series as a ribbon: one cell per year, darker for more. The line above answers how much; this answers when.
Its share of all research
Growing output can still be a shrinking share: all of science grows. This is Flow Analysis (United States) as a percentage of every work published that year, 0.00022% in 2024.
Fractional works of Flow Analysis (United States) over all fractional works that year. How the balance of science has shifted.
Other research institutions in Brooklyn
- SUNY Downstate Health Sciences University
- ASA College
- Brooklyn Law School
- Pratt Institute
- Kings County Hospital Center
- St. Francis College
- Center for Brooklyn History
- Coney Island Hospital

Share Flow Analysis (United States)'s ranking
Badges for a website1Each links back here and updates with every snapshot

Research measures only: rankings here say nothing about teaching, admissions or student experience. Comparable institutions and collaboration partners have tabs of their own, above.
Discussion
Ask a question or share a note about Flow Analysis (United States). Posts are plain text and can be reported.