Science Explorer Back to mapMap
Discussion
University · Nashua · United States

Nashua School District

World rank, all time
#26,186
of 34,923
Rank in United States
#5,479
of 7,310
Research works
144
▲ 9% vs 2018-21
Citations
1.5k
10.2 per fractional work
Top-10% rate
6.8%
all institutions 10.0%
vs its own fields
0.95×
1.00× is exactly expected
Open access
22%
world 40%
International
6%
world 18%

Which fields of science does Nashua School District work in?

In all years, 39% of research at Nashua School District is in Physical Sciences, 31% in Health Sciences. Its largest fields are Medicine (26%), Engineering (18%), Social Sciences (14%). It does 1.3× the world's share of Health Sciences.

Physical Sciences: 56 fractional works · 38.8% of its workEngineering: 26 fractional works · 17.7% of its workElectrical and Electronic Engineering: 11 fractional works · 7.6% of its workControl and Systems Engineering: 3 fractional works · 2.2% of its workAerospace Engineering: 3 fractional works · 2.1% of its workBiomedical Engineering: 2 fractional works · 1.5% of its workComputational Mechanics: 2 fractional works · 1.3% of its workMechanical Engineering: 1 fractional works · 1.0% of its workMechanics of Materials: 1 fractional works · 0.7% of its workAutomotive Engineering: 0 fractional works · 0.3% of its workSafety, Risk, Reliability and Quality: 0 fractional works · 0.3% of its workMedia Technology: 0 fractional works · 0.2% of its workSmaller subfields together: 1 fractional works · 0.4% of its workComputer Science: 10 fractional works · 7.2% of its workArtificial Intelligence: 3 fractional works · 1.9% of its workComputer Networks and Communications: 2 fractional works · 1.6% of its workSignal Processing: 1 fractional works · 0.9% of its workComputer Vision and Pattern Recognition: 1 fractional works · 0.7% of its workComputer Science Applications: 1 fractional works · 0.7% of its workInformation Systems: 1 fractional works · 0.5% of its workHardware and Architecture: 1 fractional works · 0.5% of its workSmaller subfields together: 0 fractional works · 0.2% of its workMathematics: 5 fractional works · 3.4% of its workStatistics and Probability: 3 fractional works · 2.0% of its workTheoretical Computer Science: 1 fractional works · 0.6% of its workComputational Mathematics: 0 fractional works · 0.2% of its workNumerical Analysis: 0 fractional works · 0.2% of its workMathematical Physics: 0 fractional works · 0.2% of its workSmaller subfields together: 0 fractional works · 0.2% of its workPhysics and Astronomy: 5 fractional works · 3.4% of its workAtomic and Molecular Physics, and Optics: 3 fractional works · 2.1% of its workAstronomy and Astrophysics: 1 fractional works · 0.8% of its workCondensed Matter Physics: 0 fractional works · 0.2% of its workRadiation: 0 fractional works · 0.2% of its workMaterials Science: 4 fractional works · 2.8% of its workMaterials Chemistry: 2 fractional works · 1.3% of its workElectronic, Optical and Magnetic Materials: 1 fractional works · 0.7% of its workPolymers and Plastics: 1 fractional works · 0.7% of its workSmaller subfields together: 0 fractional works · 0.1% of its workEnvironmental Science: 3 fractional works · 1.8% of its workEnvironmental Engineering: 1 fractional works · 0.5% of its workEcology: 0 fractional works · 0.3% of its workGlobal and Planetary Change: 0 fractional works · 0.3% of its workEnvironmental Chemistry: 0 fractional works · 0.2% of its workIndustrial and Manufacturing Engineering: 0 fractional works · 0.2% of its workSmaller subfields together: 0 fractional works · 0.2% of its workChemistry: 2 fractional works · 1.4% of its workPhysical and Theoretical Chemistry: 2 fractional works · 1.0% of its workSpectroscopy: 0 fractional works · 0.2% of its workSmaller subfields together: 0 fractional works · 0.1% of its workEarth and Planetary Sciences: 1 fractional works · 0.8% of its workGeophysics: 1 fractional works · 0.5% of its workAtmospheric Science: 0 fractional works · 0.2% of its workSmaller subfields together: 0 fractional works · 0.1% of its workEnergy: 1 fractional works · 0.5% of its workRenewable Energy, Sustainability and the Environment: 1 fractional works · 0.5% of its workHealth Sciences: 45 fractional works · 31.4% of its workMedicine: 37 fractional works · 25.6% of its workSurgery: 7 fractional works · 4.7% of its workEpidemiology: 3 fractional works · 2.1% of its workPulmonary and Respiratory Medicine: 3 fractional works · 2.1% of its workOncology: 2 fractional works · 1.7% of its workPathology and Forensic Medicine: 2 fractional works · 1.4% of its workCardiology and Cardiovascular Medicine: 2 fractional works · 1.4% of its workRadiology, Nuclear Medicine and Imaging: 2 fractional works · 1.3% of its workPublic Health, Environmental and Occupational Health: 2 fractional works · 1.2% of its workDermatology: 2 fractional works · 1.1% of its workNeurology: 2 fractional works · 1.1% of its workPsychiatry and Mental health: 2 fractional works · 1.1% of its workPhysiology: 1 fractional works · 0.8% of its workOphthalmology: 1 fractional works · 0.8% of its workInfectious Diseases: 1 fractional works · 0.7% of its workRheumatology: 1 fractional works · 0.7% of its workGenetics: 1 fractional works · 0.5% of its workPharmacology: 1 fractional works · 0.4% of its workAnesthesiology and Pain Medicine: 0 fractional works · 0.3% of its workOrthopedics and Sports Medicine: 0 fractional works · 0.3% of its workReproductive Medicine: 0 fractional works · 0.3% of its workUrology: 0 fractional works · 0.3% of its workEndocrinology, Diabetes and Metabolism: 0 fractional works · 0.2% of its workOtorhinolaryngology: 0 fractional works · 0.2% of its workPediatrics, Perinatology and Child Health: 0 fractional works · 0.2% of its workSmaller subfields together: 0 fractional works · 0.3% of its workHealth Professions: 7 fractional works · 5.2% of its workGeneral Health Professions: 6 fractional works · 3.9% of its workOccupational Therapy: 1 fractional works · 0.7% of its workHealth Information Management: 0 fractional works · 0.3% of its workSmaller subfields together: 0 fractional works · 0.3% of its workVeterinary: 1 fractional works · 0.4% of its workSmall Animals: 1 fractional works · 0.4% of its workDentistry: 0 fractional works · 0.3% of its workSocial Sciences: 34 fractional works · 23.8% of its workSocial Sciences: 20 fractional works · 13.8% of its workSociology and Political Science: 6 fractional works · 4.4% of its workEducation: 6 fractional works · 4.1% of its workGeography, Planning and Development: 2 fractional works · 1.4% of its workPublic Administration: 2 fractional works · 1.4% of its workSafety Research: 1 fractional works · 0.8% of its workAnthropology: 1 fractional works · 0.7% of its workGender Studies: 1 fractional works · 0.5% of its workDemography: 0 fractional works · 0.3% of its workHuman Factors and Ergonomics: 0 fractional works · 0.2% of its workPsychology: 8 fractional works · 5.4% of its workClinical Psychology: 4 fractional works · 2.7% of its workSocial Psychology: 2 fractional works · 1.6% of its workDevelopmental and Educational Psychology: 2 fractional works · 1.1% of its workDecision Sciences: 3 fractional works · 2.0% of its workManagement Science and Operations Research: 2 fractional works · 1.3% of its workStatistics, Probability and Uncertainty: 1 fractional works · 0.5% of its workInformation Systems and Management: 0 fractional works · 0.2% of its workArts and Humanities: 2 fractional works · 1.1% of its workLiterature and Literary Theory: 1 fractional works · 0.4% of its workSmaller subfields together: 1 fractional works · 0.6% of its workEconomics, Econometrics and Finance: 1 fractional works · 0.8% of its workFinance: 1 fractional works · 0.5% of its workEconomics and Econometrics: 0 fractional works · 0.2% of its workSmaller subfields together: 0 fractional works · 0.1% of its workBusiness, Management and Accounting: 1 fractional works · 0.6% of its workOrganizational Behavior and Human Resource Management: 1 fractional works · 0.4% of its workStrategy and Management: 0 fractional works · 0.2% of its workLife Sciences: 9 fractional works · 5.9% of its workBiochemistry, Genetics and Molecular Biology: 5 fractional works · 3.8% of its workMolecular Biology: 3 fractional works · 2.2% of its workGenetics: 2 fractional works · 1.2% of its workCell Biology: 0 fractional works · 0.2% of its workSmaller subfields together: 0 fractional works · 0.1% of its workNeuroscience: 2 fractional works · 1.6% of its workCognitive Neuroscience: 1 fractional works · 0.9% of its workCellular and Molecular Neuroscience: 1 fractional works · 0.4% of its workSensory Systems: 0 fractional works · 0.2% of its workSmaller subfields together: 0 fractional works · 0.1% of its workAgricultural and Biological Sciences: 0 fractional works · 0.3% of its workEcology, Evolution, Behavior and Systematics: 0 fractional works · 0.3% of its workSmaller subfields together: 0 fractional works · 0.1% of its workImmunology and Microbiology: 0 fractional works · 0.2% of its workParasitology: 0 fractional works · 0.2% of its workALL ITS WORKNashua SchoolDistrict144fractional works, all years
Life Sciences6%Physical Sciences39%Health Sciences31%Social Sciences24%

Each ring splits the one inside it: the four domains of science, their fields, their subfields. Size is fractional works in all years. Every slice is a page; the interactive view zooms down to single topics and colours each by how much more of it this institution does than the world.

Its 4 domains and 23 fields, with their numbers
    1. Engineering2617.7%
    2. Computer Science107.2%
    3. Mathematics53.4%
    4. Physics and Astronomy53.4%
    5. Materials Science42.8%
    6. Environmental Science31.8%
    7. Chemistry21.4%
    8. Earth and Planetary Sciences10.8%
    9. Energy10.5%
    1. Medicine3725.6%
    2. Health Professions75.2%
    3. Veterinary10.4%
    4. Dentistry00.3%
    1. Social Sciences2013.8%
    2. Psychology85.4%
    3. Decision Sciences32.0%
    4. Arts and Humanities21.1%
    5. Economics, Econometrics and Finance10.8%
    6. Business, Management and Accounting10.6%
    1. Biochemistry, Genetics and Molecular Biology53.8%
    2. Neuroscience21.6%
    3. Agricultural and Biological Sciences00.3%
    4. Immunology and Microbiology00.2%
All of science, and how each field's share has moved since 1950: the Science domain explorer

Field profile

Location quotient across every field it publishes in: outside the ring is more than an institution of this size would be expected to publish, inside it is less.

Agricultural and Biological Sciences: 0.13× its world share, 0 worksAgricultural and Bio…Biochemistry, Genetics and Molecular Biology: 1.80× its world share, 1 worksBiochemistry, Geneti…Neuroscience: 2.06× its world share, 0 worksNeuroscienceChemistry: 2.13× its world share, 0 worksChemistryComputer Science: 1.34× its world share, 2 worksComputer ScienceEngineering: 1.37× its world share, 3 worksEngineeringEnvironmental Science: 0.45× its world share, 0 worksEnvironmental ScienceMaterials Science: 0.96× its world share, 0 worksMaterials ScienceHealth Professions: 1.28× its world share, 0 worksHealth ProfessionsMedicine: 1.18× its world share, 3 worksMedicineArts and Humanities: 0.26× its world share, 0 worksArts and HumanitiesPsychology: 0.88× its world share, 0 worksPsychologySocial Sciences: 1.35× its world share, 3 worksSocial Sciences1×world share
more than its size predictsabout as predictedless

Rings at 0.5×, 1× and 2×. Widest outward: Chemistry, 2.1×. Every wedge is a field page.

All 13 fields, with their numbers
  1. Chemistry2.13×0 works
  2. Neuroscience2.06×0 works
  3. Biochemistry, Genetics and Molecular Biology1.80×1 works
  4. Engineering1.37×3 works
  5. Social Sciences1.35×3 works
  6. Computer Science1.34×2 works
  7. Health Professions1.28×0 works
  8. Medicine1.18×3 works
  9. Materials Science0.96×0 works
  10. Psychology0.88×0 works
  11. Environmental Science0.45×0 works
  12. Arts and Humanities0.26×0 works
  13. Agricultural and Biological Sciences0.13×0 works

Who are the top researchers at Nashua School District?

Ranked on the quality score, Dave deBronkart, Mark B. Constantian and Art Johnson lead among researchers whose main affiliation is Nashua School District.

  1. 1 Dave deBronkart United States · #827,665 worldwide 699 citations · 40 works
  2. 2 Mark B. Constantian United States · #2,768,610 worldwide 2.2k citations · 119 works
  3. 3 Art Johnson United States · #5,296,824 worldwide 302 citations · 37 works
All ranked researchers at Nashua School District

What are the most cited papers from Nashua School District?

The most cited paper from Nashua School District is "Efficacy and safety of deep transcranial magnetic stimulation for major depression: a prospective multicenter randomized controlled trial" (Yechiel Levkovitz et al., 2015), with 439 citations. Next come "Therapeutic Ionizing Radiation and the Incidence of Basal Cell Carcinoma and Squamous Cell Carcinoma" (230) and "Periodontal status of adult patients treated with fixed buccal appliances and removable aligners over one year of active orthodontic therapy" (191).

Most cited papers
#PaperReleasedCitations
1 Efficacy and safety of deep transcranial magnetic stimulation for major depression: a prospective multicenter randomized controlled trial Yechiel Levkovitz et al. · World Psychiatry Open access Feb 2015 439
2 Therapeutic Ionizing Radiation and the Incidence of Basal Cell Carcinoma and Squamous Cell Carcinoma M Lichter · Archives of Dermatology Aug 2000 230
3 Periodontal status of adult patients treated with fixed buccal appliances and removable aligners over one year of active orthodontic therapy Marzieh Karkhanechi, Denise Chow, Jennifer Sipkin et al. · The Angle Orthodontist Open access 22 Jun 2012 191
4 Estimating slowness dispersion from arrays of sonic logging waveforms S. Lang, Andrew L. Kurkjian, James H. McClellan et al. · Geophysics Apr 1987 116
5 The Boxy Nasal Tip, the Ball Tip, and Alar Cartilage Malposition: Variations on a Theme???A Study in 200 Consecutive Primary and Secondary Rhinoplasty Patients Mark B. Constantian · Plastic & Reconstructive Surgery 28 Jun 2005 97
All 60 most cited papers, with filters and sorting

Which keywords describe research at Nashua School District?

By fractional works in all years, weighted toward what it does more of than the world: Evidence-Based Practice, Epidemiology, Teacher Professional Development, Mathematics Education, Nasal Surgery, Rhinoplasty, Reflective Practice and Child Welfare.

▲ more of its work than of the world's◆ about the world's share▼ less than the world's

Size is fractional works in all years in the topics tagged with each word; colour is the word's share of this institution's work against its share of the world's. The 40 words are chosen for being large and distinctive. Each links to the topic it comes from most.

All 40 words, with their numbers
  1. Epidemiology9▲ 1.58×22 topics
  2. Evidence-Based Practice4▲ 18×5 topics
  3. Quality of Life4▲ 2.1×13 topics
  4. Artificial Intelligence3▲ 2.8×8 topics
  5. Teacher Professional Development3▲ 23×2 topics
  6. Mathematics Education3▲ 40×2 topics
  7. Risk Factors3▲ 2.1×9 topics
  8. Nasal Surgery3▲ 102×1 topic
  9. Rhinoplasty3▲ 102×1 topic
  10. Reflective Practice3▲ 12×2 topics
  11. Stress3▲ 5.2×3 topics
  12. Child Welfare3▲ 45×2 topics
  13. Educational Technology2▲ 2.6×2 topics
  14. Cultural Competence2▲ 13×2 topics
  15. Pedagogical Content Knowledge2▲ 65×1 topic
  16. Teacher Knowledge2▲ 56×1 topic
  17. Professional Development2▲ 10×2 topics
  18. Burnout2▲ 15×2 topics
  19. Frequency Synthesizer2▲ 23×2 topics
  20. Retention2▲ 70×1 topic
  21. Supervision2▲ 38×1 topic
  22. Anatomy2▲ 16×2 topics
  23. Nanowires2▲ 5.7×3 topics
  24. Medical Education2▲ 5.4×4 topics
  25. Nanoelectronics2▲ 8.0×2 topics
  26. Chronic Disease Management2▲ 7.9×2 topics
  27. Craniofacial2▲ 48×1 topic
  28. Nursing Home2▲ 32×1 topic
  29. Quality of Care2▲ 15×1 topic
  30. Reconstruction2▲ 6.0×1 topic
  31. Attachment2▲ 8.6×2 topics
  32. Concept Mapping2▲ 19×1 topic
  33. Decision Support2▲ 18×2 topics
  34. Multi-Criteria Analysis2▲ 17×2 topics
  35. Theory-Based Evaluation2▲ 44×1 topic
  36. Band Parameters1▲ 8.2×2 topics
  37. Mobile Edge Computing1▲ 14×2 topics
  38. Optical Interconnects1▲ 12×1 topic
  39. Security and Privacy1▲ 10×2 topics
  40. Semiconductor Lasers1▲ 10×1 topic

Which research topics does Nashua School District publish most on?

By volume in 2022-now: Political Economy and Marxism, Electric Vehicles and Infrastructure, Electrostatics and Colloid Interactions and Global Cancer Incidence and Screening.

  1. 1 Political Economy and Marxism Sociology and Political Science 1 works
  2. 2 Electric Vehicles and Infrastructure Electrical and Electronic Engineering 1 works
  3. 3 Electrostatics and Colloid Interactions Physical and Theoretical Chemistry 0 works
  4. 4 Global Cancer Incidence and Screening Oncology 0 works
  5. 5 Neuropeptides and Animal Physiology Cellular and Molecular Neuroscience 0 works
  6. 6 Cardiovascular Health and Risk Factors Cardiology and Cardiovascular Medicine 0 works
  7. 7 Pharmacological Receptor Mechanisms and Effects Molecular Biology 0 works
  8. 8 Aerosol Filtration and Electrostatic Precipitation Electrical and Electronic Engineering 0 works
  9. 9 Organ Transplantation Techniques and Outcomes Surgery 0 works
  10. 10 Criminal Justice and Corrections Analysis Sociology and Political Science 0 works

How open and international is its research?

Against the world's own shares: the tick on each track. Both are shares of its output, so they sit on one scale and can be read against each other as well as against the world.

openly available21.5%not open78.5%

World: 40% of research is openly available.

with international co-authors6.4%domestic only93.6%

World: 18% is written across borders.

How has Nashua School District's research output changed?

Output in 2022-2025 was 9% higher than in 2018-2021.

still counting1990200020102020
grewheldshrank

The same series as a ribbon: one cell per year, darker for more. The line above answers how much; this answers when.

Its share of all research

Growing output can still be a shrinking share: all of science grows. This is Nashua School District as a percentage of every work published that year, 0.000057% in 2024.

still counting0.00050%0.0010%Nashua School District0.000073% in 202519801990200020102020

Fractional works of Nashua School District over all fractional works that year. How the balance of science has shifted.

Other research institutions in Nashua

All research institutions in Nashua

Share Nashua School District's ranking
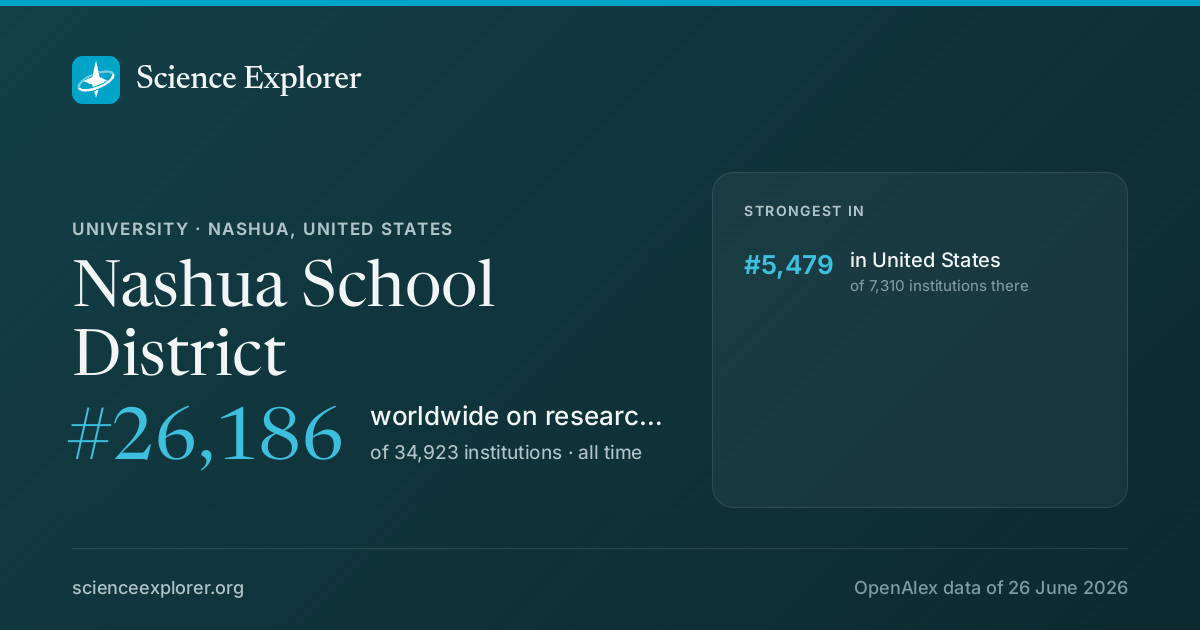
Nashua School District on Science Explorer

A card with Nashua School District's standing and the fields it leads in, for a post or a slide. A link to this page previews as the same card.

Download the card

1200 × 630 PNG, sized for social posts, drawn from the latest snapshot.

Badges for a website1Each links back here and updates with every snapshot

Research measures only: rankings here say nothing about teaching, admissions or student experience. Comparable institutions and collaboration partners have tabs of their own, above.

Discussion

Ask a question or share a note about Nashua School District. Posts are plain text and can be reported.
