American University
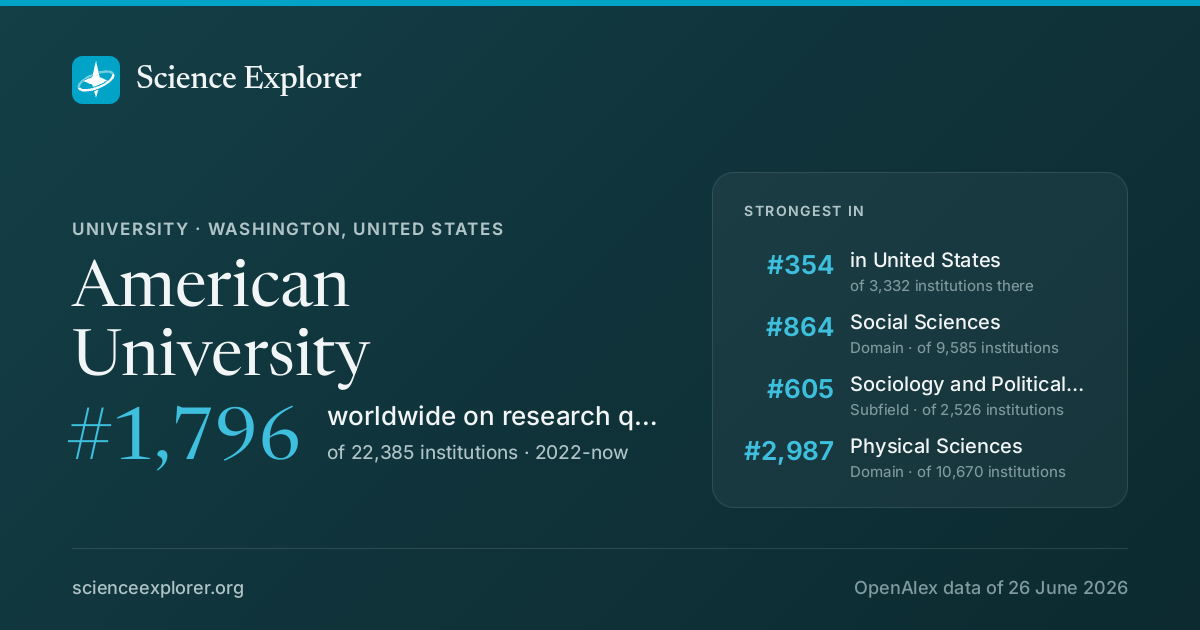
In research, American University stands highest in Social Sciences (#864 of 9,585 worldwide), Social Sciences (#788 of 5,988 worldwide) and Sociology and Political Science (#605 of 2,526 worldwide), 2022-now. Relative to its size it is most specialised in Public Administration, Political Science and International Relations and Gender Studies (Public Administration is 16.3× its share of world research).
- World rank, 2022-now
- #1,796 of 22,385 · #2,198 all time
- Rank in United States
- #354 of 3,332
- Research works
- 18k ◆ 1% vs 2018-21
- Citations
- 294k 16.8 per fractional work
- Top-10% rate
- 10.3% all institutions 10.0%
- vs its own fields
- 0.84× 1.00× is exactly expected
- Open access
- 37% world 40%
- International
- 9% world 18%
What is American University known for in research?
The fields where it stands highest, 2022-now, ranked among every institution above the floor in each field.
| Field | World rank | Where that sits | Top-10% rate | Works | All time |
|---|---|---|---|---|---|
| Social SciencesDomain | #864 of 9,585 | 10.8% | 1,487 | #646 | |
| Social SciencesField | #788 of 5,988 | 11.4% | 875 | #563 | |
| Sociology and Political ScienceSubfield | #605 of 2,526 | 11.4% | 304 | #565 | |
| Physical SciencesDomain | #2,987 of 10,670 | 10.1% | 370 | #4253 | |
| Business, Management and AccountingField | #811 of 2,581 | 11.4% | 163 | #824 | |
| Computer ScienceField | #1,434 of 4,417 | 9.7% | 146 | #2294 | |
| Health SciencesDomain | #3,526 of 9,902 | 8.2% | 202 | #3947 | |
| Life SciencesDomain | #2,286 of 6,403 | 7.5% | 120 | #3825 | |
| Economics, Econometrics and FinanceField | #662 of 1,798 | 10.8% | 169 | #695 | |
| Political Science and International RelationsSubfield | #458 of 1,187 | 13.1% | 202 | #361 |
Each strip is that field's whole ranked pool, with the notch where American University sits in it, in the colour of the band that rank falls in. The track under the rate is the rate itself: it carries no average mark, because the average differs by field (from about 6% in Dentistry to 21% in Economics).
Which of those standings moved
The same fields on both windows: where it stood over the whole record, and where it stands in 2022-now. The distance is the story, and it is the one thing the two rank columns above cannot show.
- Social Sciences#646 #864
- Social Sciences#563 #788
- Sociology and Political Science#565 #605
- Physical Sciences#4,253 #2,987
- Business, Management and Accounting#824 #811
- Computer Science#2,294 #1,434
- Health Sciences#3,947 #3,526
- Life Sciences#3,825 #2,286
- Economics, Econometrics and Finance#695 #662
- Political Science and International Relations#361 #458
A dot further right is a better standing. Fields it was not ranked in over the whole record are left out.
Which fields of science does American University work in?
In 2022-now, 68% of research at American University is in Social Sciences, 17% in Physical Sciences. Its largest fields are Social Sciences (40%), Economics, Econometrics and Finance (7%), Business, Management and Accounting (7%). It does 2.7× the world's share of Social Sciences.
Each ring splits the one inside it: the four domains of science, their fields, their subfields. Size is fractional works in 2022-now. Every slice is a page; the interactive view zooms down to single topics and colours each by how much more of it this institution does than the world.
Its 4 domains and 26 fields, with their numbers
- Social Sciences1,64167.9%
- Social Sciences97740.5%
- Economics, Econometrics and Finance1797.4%
- Business, Management and Accounting1747.2%
- Arts and Humanities1405.8%
- Psychology1295.3%
- Decision Sciences421.7%
- Physical Sciences41417.1%
- Computer Science1626.7%
- Environmental Science753.1%
- Engineering723.0%
- Physics and Astronomy371.5%
- Mathematics220.9%
- Earth and Planetary Sciences160.7%
- Energy130.5%
- Chemistry80.3%
- Materials Science70.3%
- Chemical Engineering20.1%
- Health Sciences2219.2%
- Medicine1425.9%
- Health Professions692.9%
- Dentistry50.2%
- Nursing50.2%
- Veterinary10.0%
- Life Sciences1395.8%
What does American University specialise in?
Where its research is concentrated relative to its size: Public Administration takes 16.3× the share of its output that it takes of world research.
- Public AdministrationSubfield · 21.2 works16×
- Political Science and International RelationsSubfield · 225.1 works6.3×
- Gender StudiesSubfield · 53.8 works6.2×
- CommunicationSubfield · 37.1 works5.6×
- General Economics, Econometrics and FinanceSubfield · 27.9 works4.6×
Location quotient, a volume reading rather than an impact one. It surfaces small, lopsided specialities.
Field profile
Location quotient across every field it publishes in: outside the ring is more than an institution of this size would be expected to publish, inside it is less.
Rings at 0.5×, 1× and 2×. Widest outward: Economics, Econometrics and Finance, 3.5×. Every wedge is a field page.
All 26 fields, with their numbers
- Economics, Econometrics and Finance3.46×179 works
- Social Sciences3.20×977 works
- Business, Management and Accounting2.24×174 works
- Arts and Humanities2.01×140 works
- Decision Sciences1.79×42 works
- Psychology1.75×129 works
- Health Professions1.08×69 works
- Neuroscience0.95×37 works
- Computer Science0.86×162 works
- Mathematics0.78×22 works
- Physics and Astronomy0.70×37 works
- Environmental Science0.63×76 works
- Energy0.57×13 works
- Pharmacology, Toxicology and Pharmaceutics0.49×4 works
- Agricultural and Biological Sciences0.45×51 works
- Earth and Planetary Sciences0.43×16 works
- Dentistry0.42×5 works
- Nursing0.40×5 works
- Biochemistry, Genetics and Molecular Biology0.33×42 works
- Medicine0.31×142 works
- Veterinary0.24×1 works
- Chemistry0.20×8 works
- Engineering0.20×72 works
- Immunology and Microbiology0.19×4 works
- Chemical Engineering0.18×2 works
- Materials Science0.08×7 works
- Economics, Econometrics and Finance 3.5×
- Social Sciences 3.2×
- Business, Management and Accounting 2.2×
- Arts and Humanities 2.0×
- Decision Sciences 1.8×
- Psychology 1.8×
- Health Professions 1.1×
- Neuroscience 0.9×
- Computer Science 0.9×
- Mathematics 0.8×
- Physics and Astronomy 0.7×
- Environmental Science 0.6×
- Energy 0.6×
- Pharmacology, Toxicology and Pharmaceutics 0.5×
- Agricultural and Biological Sciences 0.5×
- Earth and Planetary Sciences 0.4×
- Dentistry 0.4×
- Nursing 0.4×
- Biochemistry, Genetics and Molecular Biology 0.3×
- Medicine 0.3×
- Veterinary 0.2×
- Chemistry 0.2×
- Engineering 0.2×
- Immunology and Microbiology 0.2×
- Chemical Engineering 0.2×
- Materials Science 0.1×
Who are the top researchers at American University?
Ranked on the quality score, Jessica A. Gephart, Catherine J. Stoodley and Andrew R. Flores lead among researchers whose main affiliation is American University.
- 1
Jessica A. Gephart
 United States · #8,546 worldwide
9.8k citations · 144 works
- 2
Catherine J. Stoodley
United States · #69,171 worldwide
13k citations · 80 works
- 3
Andrew R. Flores
United States · #85,232 worldwide
4.2k citations · 111 works
- 4
Thomas C. Zeitzoff
United States · #107,677 worldwide
3.4k citations · 96 works
- 5
J. M. Newport
United States · #114,313 worldwide
16k citations · 46 works
- 6
Kim M. Blankenship
United States · #137,125 worldwide
4.6k citations · 110 works
- 7
Jennifer L. Lawless
United States · #162,511 worldwide
6.4k citations · 152 works
- 8
Valentina Giulia Bruno
United States · #182,309 worldwide
2.6k citations · 62 works
- 9
Amitav Acharya
United States · #183,647 worldwide
14k citations · 368 works
- 10
Stephen E Rock
United States · #201,642 worldwide
12k citations · 155 works
Which keywords describe research at American University?
By fractional works in 2022-now, weighted toward what it does more of than the world: Globalization, Nationalism, Human Rights, Democracy, Identity, Global Governance, Gender and Economic Growth.
- Gender Inequality
- Intersectionality
- Immigration
- NGOs
- Monetary Policy
- Governance
- Culture
- Social Capital
- Ethics
- Corporate Governance
- Political Economy
- Politics
- International Law
- Neoliberalism
- Education
- Gender
- Identity
- Nationalism
- Social Media
- Human Rights
- Globalization
- Machine Learning
- Sustainability
- Economic Growth
- Mental Health
- Democracy
- Innovation
- Global Governance
- Colonialism
- Economic Development
- Public Opinion
- International Relations
- History
- Feminism
- Discrimination
- Religion
- Labor Market
- Race
- Firm Performance
- Postcolonialism
Size is fractional works in 2022-now in the topics tagged with each word; colour is the word's share of this institution's work against its share of the world's. The 40 words are chosen for being large and distinctive. Each links to the topic it comes from most.
All 40 words, with their numbers
- Globalization213▲ 4.5×10⁷ topics
- Human Rights98▲ 4.0×63 topics
- Machine Learning94▲ 1.18×73 topics
- Social Media84▲ 2.5×32 topics
- Sustainability78▲ 1.31×76 topics
- Nationalism77▲ 7.1×26 topics
- Economic Growth75▲ 3.8×27 topics
- Identity73▲ 4.2×47 topics
- Mental Health70▲ 2.0×39 topics
- Gender66▲ 5.0×39 topics
- Democracy62▲ 7.3×22 topics
- Education60▲ 1.45×67 topics
- Innovation58▲ 2.3×39 topics
- Neoliberalism54▲ 6.3×22 topics
- Global Governance54▲ 9.4×22 topics
- International Law53▲ 7.0×25 topics
- Colonialism52▲ 4.6×36 topics
- Politics49▲ 7.7×16 topics
- Economic Development49▲ 2.5×31 topics
- Political Economy46▲ 7.5×16 topics
- Public Opinion46▲ 16×5 topics
- Corporate Governance46▲ 2.6×23 topics
- International Relations44▲ 7.5×26 topics
- Ethics44▲ 3.6×31 topics
- History43▲ 2.6×29 topics
- Social Capital39▲ 3.1×18 topics
- Feminism38▲ 5.4×19 topics
- Culture38▲ 3.0×20 topics
- Discrimination37▲ 7.4×8 topics
- Governance37▲ 4.7×15 topics
- Religion36▲ 3.2×24 topics
- Monetary Policy31▲ 5.5×10 topics
- Labor Market31▲ 4.5×11 topics
- NGOs30▲ 13×4 topics
- Race30▲ 10×16 topics
- Immigration30▲ 11×6 topics
- Firm Performance29▲ 6.8×3 topics
- Intersectionality28▲ 6.1×12 topics
- Postcolonialism26▲ 7.4×15 topics
- Gender Inequality25▲ 7.4×6 topics
Which research topics does American University publish most on?
By volume in 2022-now: American Constitutional Law and Politics, Big Data and Business Intelligence, Electoral Systems and Political Participation and Jewish and Middle Eastern Studies.
Area is fractional works; colour is the subfield each topic belongs to.
- 1 American Constitutional Law and Politics Political Science and International Relations 17 works
- 2 Big Data and Business Intelligence Management Information Systems 17 works
- 3 Electoral Systems and Political Participation Political Science and International Relations 15 works
- 4 Jewish and Middle Eastern Studies Sociology and Political Science 15 works
- 5 Terrorism, Counterterrorism, and Political Violence Sociology and Political Science 14 works
- 6 Migration and Labor Dynamics Sociology and Political Science 14 works
- 7 Social Media and Politics Communication 13 works
- 8 Global Peace and Security Dynamics Political Science and International Relations 13 works
- 9 Public Policy and Administration Research Public Administration 13 works
- 10 International Development and Aid Development 12 works
How open and international is its research?
Against the world's own shares: the tick on each track. Both are shares of its output, so they sit on one scale and can be read against each other as well as against the world.
World: 40% of research is openly available.
World: 18% is written across borders.
How has American University's research output changed?
Output in 2022-2025 was 1% lower than in 2018-2021.
The same series as a ribbon: one cell per year, darker for more. The line above answers how much; this answers when.
Its share of all research
Growing output can still be a shrinking share: all of science grows. This is American University as a percentage of every work published that year, 0.0098% in 2024.
Fractional works of American University over all fractional works that year. How the balance of science has shifted.
How much of it reaches the world top 10%
Year by year, against all institutions in the same year.
Of each year's output, the share that reached the world's 10% most cited for its field and year. Peak 14.4% in 2016.
Other research institutions in Washington
- United States Department of Defense
- National Aeronautics and Space Administration
- United States Department of Agriculture
- United States Department of Veterans Affairs
- United States Department of Health and Human Services
- Georgetown University
- George Washington University
- National Oceanic and Atmospheric Administration








Share American University's ranking



Research measures only: rankings here say nothing about teaching, admissions or student experience. Comparable institutions and collaboration partners have tabs of their own, above.
Discussion
Ask a question or share a note about American University. Posts are plain text and can be reported.