Statistics Norway
In research, Statistics Norway stands highest in Social Sciences (#5,102 of 9,585 worldwide), 2022-now. Relative to its size it is most specialised in Economics and Econometrics and Economics, Econometrics and Finance (Economics and Econometrics is 9.7× its share of world research).
- World rank, 2022-now
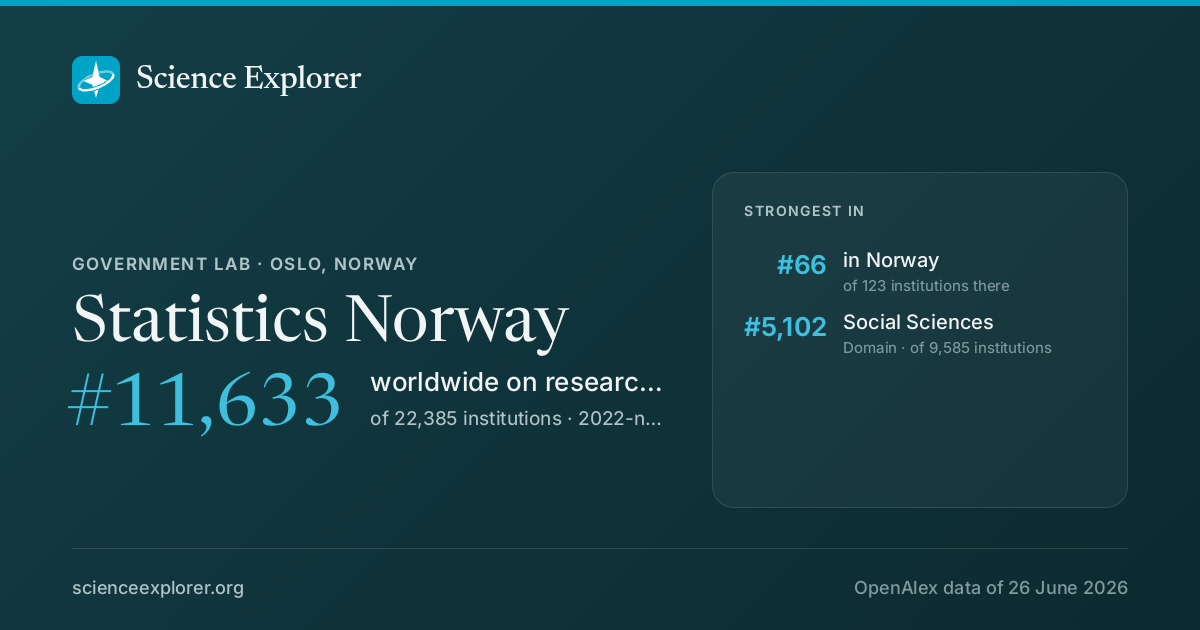
- #11,633 of 22,385 · #5,356 all time
- Rank in Norway
- #66 of 123
- Research works
- 1.3k ▼ 4% vs 2018-21
- Citations
- 40k 29.8 per fractional work
- Top-10% rate
- 11.8% all institutions 10.0%
- vs its own fields
- 0.95× 1.00× is exactly expected
- Open access
- 51% world 40%
- International
- 22% world 18%
What is Statistics Norway known for in research?
The fields where it stands highest, 2022-now, ranked among every institution above the floor in each field.
| Field | World rank | Where that sits | Top-10% rate | Works | All time |
|---|---|---|---|---|---|
| Social SciencesDomain | #5,102 of 9,585 | 13.8% | 94 | #2304 |
Each strip is that field's whole ranked pool, with the notch where Statistics Norway sits in it, in the colour of the band that rank falls in. The track under the rate is the rate itself: it carries no average mark, because the average differs by field (from about 6% in Dentistry to 21% in Economics).
Which fields of science does Statistics Norway work in?
In 2022-now, 56% of research at Statistics Norway is in Social Sciences, 26% in Physical Sciences. Its largest fields are Social Sciences (26%), Economics, Econometrics and Finance (18%), Medicine (7%). It does 2.2× the world's share of Social Sciences.
Each ring splits the one inside it: the four domains of science, their fields, their subfields. Size is fractional works in 2022-now. Every slice is a page; the interactive view zooms down to single topics and colours each by how much more of it this institution does than the world.
Its 4 domains and 25 fields, with their numbers
- Social Sciences10455.6%
- Social Sciences4825.8%
- Economics, Econometrics and Finance3317.8%
- Psychology105.3%
- Business, Management and Accounting73.6%
- Decision Sciences42.3%
- Arts and Humanities10.7%
- Physical Sciences4926.3%
- Engineering116.1%
- Environmental Science115.8%
- Mathematics105.3%
- Computer Science73.7%
- Energy63.0%
- Materials Science20.8%
- Physics and Astronomy10.7%
- Earth and Planetary Sciences10.6%
- Chemistry10.3%
- Chemical Engineering00.0%
- Health Sciences2413.1%
- Medicine137.1%
- Health Professions105.3%
- Dentistry10.4%
- Nursing10.3%
- Life Sciences105.1%
What does Statistics Norway specialise in?
Where its research is concentrated relative to its size: Economics and Econometrics takes 9.7× the share of its output that it takes of world research.
- Economics and EconometricsSubfield · 28.6 works9.7×
- Economics, Econometrics and FinanceField · 33.2 works8.3×
Location quotient, a volume reading rather than an impact one. It surfaces small, lopsided specialities.
Field profile
Location quotient across every field it publishes in: outside the ring is more than an institution of this size would be expected to publish, inside it is less.
Rings at 0.5×, 1× and 2×. Widest outward: Economics, Econometrics and Finance, 8.3×. Every wedge is a field page.
All 25 fields, with their numbers
- Economics, Econometrics and Finance8.32×33 works
- Mathematics4.46×10 works
- Energy3.29×6 works
- Decision Sciences2.42×4 works
- Social Sciences2.04×48 works
- Health Professions2.00×10 works
- Psychology1.74×10 works
- Environmental Science1.17×11 works
- Business, Management and Accounting1.13×7 works
- Dentistry0.83×1 works
- Nursing0.69×1 works
- Agricultural and Biological Sciences0.56×5 works
- Neuroscience0.56×2 works
- Computer Science0.48×7 works
- Engineering0.40×11 works
- Earth and Planetary Sciences0.39×1 works
- Immunology and Microbiology0.38×1 works
- Medicine0.37×13 works
- Physics and Astronomy0.31×1 works
- Materials Science0.24×2 works
- Arts and Humanities0.24×1 works
- Biochemistry, Genetics and Molecular Biology0.21×2 works
- Chemistry0.19×0 works
- Pharmacology, Toxicology and Pharmaceutics0.13×0 works
- Chemical Engineering0.10×0 works
- Economics, Econometrics and Finance 8.3×
- Mathematics 4.5×
- Energy 3.3×
- Decision Sciences 2.4×
- Social Sciences 2.0×
- Health Professions 2.0×
- Psychology 1.7×
- Environmental Science 1.2×
- Business, Management and Accounting 1.1×
- Dentistry 0.8×
- Nursing 0.7×
- Agricultural and Biological Sciences 0.6×
- Neuroscience 0.6×
- Computer Science 0.5×
- Engineering 0.4×
- Earth and Planetary Sciences 0.4×
- Immunology and Microbiology 0.4×
- Medicine 0.4×
- Physics and Astronomy 0.3×
- Materials Science 0.2×
- Arts and Humanities 0.2×
- Biochemistry, Genetics and Molecular Biology 0.2×
- Chemistry 0.2×
- Pharmacology, Toxicology and Pharmaceutics 0.1×
- Chemical Engineering 0.1×
Who are the top researchers at Statistics Norway?
Ranked on the quality score, Trude Lappegård, Kjetil Elias Telle and Andreas Fagereng lead among researchers whose main affiliation is Statistics Norway.
- 1
Trude Lappegård
 Norway · #86,458 worldwide
6.2k citations · 121 works
- 2
Kjetil Elias Telle
Norway · #220,682 worldwide
3.9k citations · 149 works
- 3
Andreas Fagereng
Norway · #221,861 worldwide
2.2k citations · 60 works
- 4
Lars Dommermuth
Norway · #320,268 worldwide
1.8k citations · 67 works
- 5
Marit Rønsen
Norway · #412,513 worldwide
2.4k citations · 70 works
- 6
Knut Einar Rosendahl
Norway · #685,153 worldwide
4.4k citations · 268 works
- 7
Rolf Aaberge
Norway · #905,398 worldwide
3.9k citations · 194 works
- 8
Eilev Sandvik Jansen
Norway · #921,636 worldwide
1.8k citations · 70 works
- 9
Ola Lotherington Vestad
Norway · #959,994 worldwide
542 citations · 38 works
- 10
Andreas Kostøl
Norway · #1,012,899 worldwide
897 citations · 48 works
Which keywords describe research at Statistics Norway?
By fractional works in 2022-now, weighted toward what it does more of than the world: Economic Growth, Fiscal Policy, Income Tax, Labor Market, Climate Change, Economic Development, Labor Force Participation and Health Outcomes.
- Neighborhood Effects
- Divorce
- Welfare Reform
- Policy Instruments
- Economic Impacts
- Life Expectancy
- Consumption
- Infrastructure
- Unemployment
- Transport Infrastructure
- Social Support
- Social Policy
- Income Inequality
- Energy Efficiency
- Energy Transition
- Health Outcomes
- Environmental Impact
- Labor Market
- Income Tax
- Climate Change
- Economic Growth
- Fiscal Policy
- Economic Development
- Globalization
- Renewable Energy
- Labor Force Participation
- Gender Inequality
- Greenhouse Gas Emissions
- Regional Development
- Global Warming
- Taxation
- Environmental Policy
- Household Behavior
- Public Investment
- Rebound Effect
- Parenting
- Gender Roles
- Household Decision Making
- Fertility
- Family Structure
Size is fractional works in 2022-now in the topics tagged with each word; colour is the word's share of this institution's work against its share of the world's. The 40 words are chosen for being large and distinctive. Each links to the topic it comes from most.
All 40 words, with their numbers
- Economic Growth13▲ 8.6×10 topics
- Climate Change12▲ 2.3×32 topics
- Fiscal Policy8▲ 22×6 topics
- Income Tax8▲ 55×2 topics
- Economic Development8▲ 5.1×12 topics
- Labor Market8▲ 14×6 topics
- Globalization7▲ 1.99×19 topics
- Environmental Impact7▲ 2.1×16 topics
- Renewable Energy6▲ 2.3×12 topics
- Health Outcomes6▲ 11×6 topics
- Labor Force Participation6▲ 68×2 topics
- Energy Transition5▲ 20×3 topics
- Gender Inequality5▲ 21×5 topics
- Energy Efficiency5▲ 3.0×6 topics
- Greenhouse Gas Emissions5▲ 9.5×3 topics
- Income Inequality5▲ 18×5 topics
- Regional Development5▲ 7.3×3 topics
- Social Policy5▲ 27×2 topics
- Global Warming4▲ 5.7×6 topics
- Social Support4▲ 4.5×8 topics
- Taxation4▲ 30×2 topics
- Transport Infrastructure4▲ 29×2 topics
- Environmental Policy4▲ 11×3 topics
- Unemployment4▲ 28×2 topics
- Household Behavior4▲ 25×2 topics
- Infrastructure4▲ 19×1 topic
- Public Investment4▲ 42×1 topic
- Consumption4▲ 39×1 topic
- Rebound Effect4▲ 39×1 topic
- Life Expectancy4▲ 40×2 topics
- Parenting4▲ 17×2 topics
- Economic Impacts4▲ 30×1 topic
- Gender Roles4▲ 17×2 topics
- Policy Instruments4▲ 33×1 topic
- Household Decision Making4▲ 87×1 topic
- Welfare Reform4▲ 87×1 topic
- Fertility3▲ 21×2 topics
- Divorce3▲ 96×1 topic
- Family Structure3▲ 82×1 topic
- Neighborhood Effects3▲ 16×3 topics
Which research topics does Statistics Norway publish most on?
By volume in 2022-now: Fiscal Policy and Economic Growth, Energy, Environment, and Transportation Policies, Climate Change Policy and Economics and Gender, Labor, and Family Dynamics.
Area is fractional works; colour is the subfield each topic belongs to.
- 1 Fiscal Policy and Economic Growth Economics and Econometrics 4 works
- 2 Energy, Environment, and Transportation Policies Renewable Energy, Sustainability and the Environment 4 works
- 3 Climate Change Policy and Economics Economics and Econometrics 4 works
- 4 Gender, Labor, and Family Dynamics Gender Studies 4 works
- 5 Family Dynamics and Relationships Demography 3 works
- 6 Census and Population Estimation Statistics and Probability 3 works
- 7 Global Health Care Issues General Health Professions 3 works
- 8 Employment and Welfare Studies General Health Professions 2 works
- 9 Labor market dynamics and wage inequality Economics and Econometrics 2 works
- 10 Retirement, Disability, and Employment Demography 2 works
How open and international is its research?
Against the world's own shares: the tick on each track. Both are shares of its output, so they sit on one scale and can be read against each other as well as against the world.
World: 40% of research is openly available.
World: 18% is written across borders.
How has Statistics Norway's research output changed?
Output in 2022-2025 was 4% lower than in 2018-2021.
The same series as a ribbon: one cell per year, darker for more. The line above answers how much; this answers when.
Its share of all research
Growing output can still be a shrinking share: all of science grows. This is Statistics Norway as a percentage of every work published that year, 0.00063% in 2024.
Fractional works of Statistics Norway over all fractional works that year. How the balance of science has shifted.
How much of it reaches the world top 10%
Year by year, against all institutions in the same year.
Of each year's output, the share that reached the world's 10% most cited for its field and year. Peak 21.5% in 2011.
Other research institutions in Oslo
- University of Oslo
- OsloMet – Oslo Metropolitan University
- Norwegian Institute of Public Health
- Norwegian Cancer Society
- BI Norwegian Business School
- Norwegian Defence Research Establishment
- Norsk Hydro (Norway)
- The Research Council of Norway




Share Statistics Norway's ranking
Badges for a website1Each links back here and updates with every snapshot

Research measures only: rankings here say nothing about teaching, admissions or student experience. Comparable institutions and collaboration partners have tabs of their own, above.
Discussion
Ask a question or share a note about Statistics Norway. Posts are plain text and can be reported.