Universal Instruments (United States)
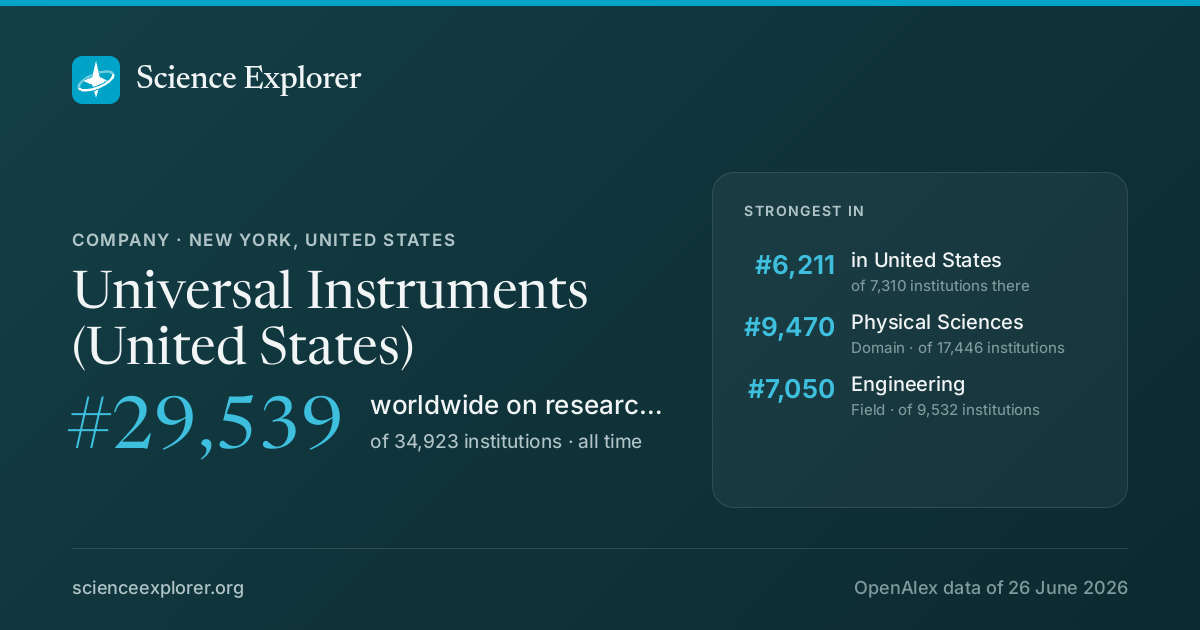
In research, Universal Instruments (United States) stands highest in Physical Sciences (#9,470 of 17,446 worldwide) and Engineering (#7,050 of 9,532 worldwide), over all time.
- World rank, all time
- #29,539 of 34,923
- Rank in United States
- #6,211 of 7,310
- Research works
- 182 ◆ 2% vs 2018-21
- Citations
- 1.8k 9.8 per fractional work
- Top-10% rate
- 12.9% all institutions 10.0%
- vs its own fields
- 1.08× 1.00× is exactly expected
- Open access
- 8% world 40%
- International
- 4% world 18%
What is Universal Instruments (United States) known for in research?
The fields where it stands highest, over all time, ranked among every institution above the floor in each field.
| Field | World rank | Where that sits | Top-10% rate | Works |
|---|---|---|---|---|
| Physical SciencesDomain | #9,470 of 17,446 | 6.1% | 170 | |
| EngineeringField | #7,050 of 9,532 | 6.4% | 144 |
Each strip is that field's whole ranked pool, with the notch where Universal Instruments (United States) sits in it, in the colour of the band that rank falls in. The track under the rate is the rate itself: it carries no average mark, because the average differs by field (from about 6% in Dentistry to 21% in Economics).
Which fields of science does Universal Instruments (United States) work in?
In all years, 93% of research at Universal Instruments (United States) is in Physical Sciences, 4% in Social Sciences. Its largest fields are Engineering (79%), Materials Science (6%), Computer Science (5%). It does 2.2× the world's share of Physical Sciences.
Each ring splits the one inside it: the four domains of science, their fields, their subfields. Size is fractional works in all years. Every slice is a page; the interactive view zooms down to single topics and colours each by how much more of it this institution does than the world.
Its 4 domains and 18 fields, with their numbers
- Physical Sciences17093.5%
- Engineering14479.3%
- Materials Science126.3%
- Computer Science94.9%
- Physics and Astronomy31.7%
- Environmental Science10.6%
- Energy10.4%
- Chemistry00.2%
- Social Sciences74.1%
- Health Sciences31.4%
- Medicine21.4%
- Veterinary00.1%
- Life Sciences21.0%
Field profile
Location quotient across every field it publishes in: outside the ring is more than an institution of this size would be expected to publish, inside it is less.
Rings at 0.5×, 1× and 2×. Widest outward: Engineering, 5.5×. Every wedge is a field page.
All 7 fields, with their numbers
- Engineering5.45×13 works
- Physics and Astronomy2.64×1 works
- Materials Science1.58×1 works
- Arts and Humanities0.35×0 works
- Medicine0.16×0 works
- Social Sciences0.16×0 works
- Biochemistry, Genetics and Molecular Biology0.13×0 works
Who are the top researchers at Universal Instruments (United States)?
Ranked on the quality score, Anthony A. Primavera, W. A. W. Cummings and Jim Wilcox lead among researchers whose main affiliation is Universal Instruments (United States).
- 1
Anthony A. Primavera
 United States · #2,141,039 worldwide
422 citations · 25 works
- 2
W. A. W. Cummings
United States · #3,060,426 worldwide
565 citations · 22 works
- 3
Jim Wilcox
United States · #3,904,557 worldwide
72 citations · 24 works
- 4
Denis Barbini
United States · #4,877,987 worldwide
7 citations · 23 works
- 5
George R. Westby
United States · #5,104,024 worldwide
500 citations · 37 works
- 6
Michael Meilunas
United States · #5,106,218 worldwide
240 citations · 46 works
- 7
Martin K. Anselm
United States · #5,655,784 worldwide
222 citations · 42 works
Which keywords describe research at Universal Instruments (United States)?
By fractional works in all years, weighted toward what it does more of than the world: Electromigration, Nanoparticles, High-Temperature Electronics, Interfacial Reactions, Lead-free Solders, Thermal Management, System Integration and Interconnect.
- Aluminium Alloys
- SCR Devices
- FPGA
- Microelectronics
- Thermodynamics
- Additive Manufacturing
- Crystal Growth
- Phase Diagrams
- Inkjet Printing
- Photon Emission Microscopy
- Flexible Electronics
- Assembly Planning
- Failure Analysis
- Aerospace Applications
- Thin Films
- Mechanical Properties
- Interconnect
- Thermal Management
- Interfacial Reactions
- Nanoparticles
- Electromigration
- High-Temperature Electronics
- Lead-free Solders
- System Integration
- Through-Silicon Via
- Microstructure
- Graphene
- Integrated Circuits
- Microstructural Evolution
- Design for Manufacture
- Laser Voltage Probing
- Processing Techniques
- Transparent Electrodes
- CMOS Technology
- Polymer Composites
- Alloys
- Power Electronics
- ESD Protection
- Grain Refinement
- Electrical Resistivity
Size is fractional works in all years in the topics tagged with each word; colour is the word's share of this institution's work against its share of the world's. The 40 words are chosen for being large and distinctive. Each links to the topic it comes from most.
All 40 words, with their numbers
- Electromigration39▲ 406×2 topics
- Nanoparticles39▲ 16×5 topics
- High-Temperature Electronics37▲ 282×2 topics
- Interfacial Reactions36▲ 697×1 topic
- Lead-free Solders36▲ 697×1 topic
- Thermal Management24▲ 46×5 topics
- System Integration21▲ 434×2 topics
- Interconnect20▲ 465×1 topic
- Through-Silicon Via20▲ 465×1 topic
- Mechanical Properties16▲ 9.2×10 topics
- Microstructure12▲ 14×9 topics
- Thin Films8▲ 16×4 topics
- Graphene8▲ 8.4×3 topics
- Aerospace Applications6▲ 26×2 topics
- Integrated Circuits5▲ 12×3 topics
- Failure Analysis5▲ 20×3 topics
- Microstructural Evolution5▲ 16×3 topics
- Assembly Planning5▲ 30×1 topic
- Design for Manufacture5▲ 30×1 topic
- Flexible Electronics5▲ 18×3 topics
- Laser Voltage Probing4▲ 48×1 topic
- Photon Emission Microscopy4▲ 48×1 topic
- Processing Techniques4▲ 25×2 topics
- Inkjet Printing4▲ 178×1 topic
- Transparent Electrodes4▲ 178×1 topic
- Phase Diagrams4▲ 35×2 topics
- CMOS Technology4▲ 18×2 topics
- Crystal Growth4▲ 6.4×2 topics
- Polymer Composites4▲ 12×2 topics
- Additive Manufacturing4▲ 10×4 topics
- Alloys4▲ 150×1 topic
- Thermodynamics4▲ 22×1 topic
- Power Electronics4▲ 7.3×4 topics
- Microelectronics4▲ 74×2 topics
- ESD Protection3▲ 97×1 topic
- FPGA3▲ 22×3 topics
- Grain Refinement3▲ 13×2 topics
- SCR Devices3▲ 97×1 topic
- Electrical Resistivity3▲ 47×2 topics
- Aluminium Alloys3▲ 35×1 topic
Which research topics does Universal Instruments (United States) publish most on?
By volume in 2022-now: Electronic Packaging and Soldering Technologies, 3D IC and TSV technologies, Manufacturing Process and Optimization and Additive Manufacturing and 3D Printing Technologies.
Area is fractional works; colour is the subfield each topic belongs to.
- 1 Electronic Packaging and Soldering Technologies Electrical and Electronic Engineering 3 works
- 2 3D IC and TSV technologies Electrical and Electronic Engineering 2 works
- 3 Manufacturing Process and Optimization Industrial and Manufacturing Engineering 2 works
- 4 Additive Manufacturing and 3D Printing Technologies Automotive Engineering 1 works
- 5 Adhesion, Friction, and Surface Interactions Mechanics of Materials 1 works
- 6 VLSI and FPGA Design Techniques Electrical and Electronic Engineering 1 works
- 7 Thermal properties of materials Materials Chemistry 1 works
- 8 Engineering and Materials Science Studies Mechanical Engineering 0 works
- 9 Sports Performance and Training Orthopedics and Sports Medicine 0 works
- 10 Aluminum Alloy Microstructure Properties Aerospace Engineering 0 works
How open and international is its research?
Against the world's own shares: the tick on each track. Both are shares of its output, so they sit on one scale and can be read against each other as well as against the world.
World: 40% of research is openly available.
World: 18% is written across borders.
How has Universal Instruments (United States)'s research output changed?
Output in 2022-2025 was 2% lower than in 2018-2021.
The same series as a ribbon: one cell per year, darker for more. The line above answers how much; this answers when.
Its share of all research
Growing output can still be a shrinking share: all of science grows. This is Universal Instruments (United States) as a percentage of every work published that year, 0.000063% in 2024.
Fractional works of Universal Instruments (United States) over all fractional works that year. How the balance of science has shifted.
Other research institutions in New York
- Columbia University
- New York University
- City University of New York
- Mount Sinai Health System
- Memorial Sloan Kettering Cancer Center
- Human Growth Foundation
- Pfizer (United States)
- Rockefeller University

Share Universal Instruments (United States)'s ranking
Badges for a website1Each links back here and updates with every snapshot

Research measures only: rankings here say nothing about teaching, admissions or student experience. Comparable institutions and collaboration partners have tabs of their own, above.
Discussion
Ask a question or share a note about Universal Instruments (United States). Keep it to the research: no personal attacks, advertising or links. Any reader can report a post, which collapses it for everyone until it is opened.