Washington State University
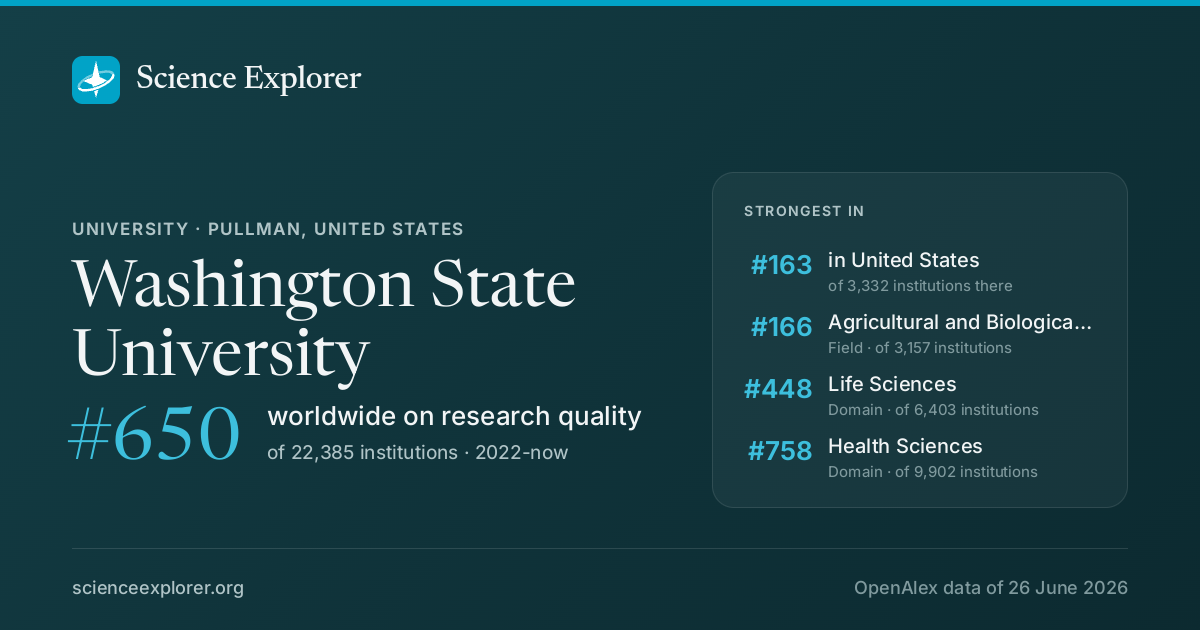
In research, Washington State University stands highest in Agricultural and Biological Sciences (#166 of 3,157 worldwide), Life Sciences (#448 of 6,403 worldwide) and Health Sciences (#758 of 9,902 worldwide), 2022-now. Relative to its size it is most specialised in Oceanography, Astronomy and Astrophysics and Environmental Chemistry (Oceanography is 15.4× its share of world research).
- World rank, 2022-now
- #650 of 22,385 · #504 all time
- Rank in United States
- #163 of 3,332
- Research works
- 60k ▼ 17% vs 2018-21
- Citations
- 2.1M 34.9 per fractional work
- Top-10% rate
- 11.2% all institutions 10.0%
- vs its own fields
- 0.84× 1.00× is exactly expected
- Open access
- 33% world 40%
- International
- 12% world 18%
What is Washington State University known for in research?
The fields where it stands highest, 2022-now, ranked among every institution above the floor in each field.
| Field | World rank | Where that sits | Top-10% rate | Works | All time |
|---|---|---|---|---|---|
| Agricultural and Biological SciencesField | #166 of 3,157 | 13.2% | 700 | #120 | |
| Life SciencesDomain | #448 of 6,403 | 10.9% | 1,483 | #326 | |
| Health SciencesDomain | #758 of 9,902 | 10.4% | 1,088 | #893 | |
| Physical SciencesDomain | #901 of 10,670 | 11.9% | 3,243 | #589 | |
| Social SciencesDomain | #889 of 9,585 | 10.9% | 1,315 | #515 | |
| MedicineField | #802 of 8,541 | 10.5% | 830 | #927 | |
| Plant ScienceSubfield | #134 of 1,317 | 12.2% | 359 | #106 | |
| EngineeringField | #628 of 5,901 | 11.4% | 855 | #487 | |
| Social SciencesField | #962 of 5,988 | 11.0% | 610 | #478 | |
| Biochemistry, Genetics and Molecular BiologyField | #552 of 2,964 | 9.7% | 523 | #371 |
Each strip is that field's whole ranked pool, with the notch where Washington State University sits in it, in the colour of the band that rank falls in. The track under the rate is the rate itself: it carries no average mark, because the average differs by field (from about 6% in Dentistry to 21% in Economics).
Which of those standings moved
The same fields on both windows: where it stood over the whole record, and where it stands in 2022-now. The distance is the story, and it is the one thing the two rank columns above cannot show.
- Agricultural and Biological Sciences#120 #166
- Life Sciences#326 #448
- Health Sciences#893 #758
- Physical Sciences#589 #901
- Social Sciences#515 #889
- Medicine#927 #802
- Plant Science#106 #134
- Engineering#487 #628
- Social Sciences#478 #962
- Biochemistry, Genetics and Molecular Biology#371 #552
A dot further right is a better standing. Fields it was not ranked in over the whole record are left out.
Which fields of science does Washington State University work in?
In 2022-now, 45% of research at Washington State University is in Physical Sciences, 21% in Life Sciences. Its largest fields are Engineering (12%), Medicine (12%), Agricultural and Biological Sciences (10%). It does 1.6× the world's share of Life Sciences.
Each ring splits the one inside it: the four domains of science, their fields, their subfields. Size is fractional works in 2022-now. Every slice is a page; the interactive view zooms down to single topics and colours each by how much more of it this institution does than the world.
Its 4 domains and 26 fields, with their numbers
- Physical Sciences3,50944.8%
- Engineering95412.2%
- Physics and Astronomy6358.1%
- Environmental Science5767.4%
- Earth and Planetary Sciences5046.4%
- Computer Science3364.3%
- Materials Science2413.1%
- Chemistry1211.5%
- Mathematics580.7%
- Energy450.6%
- Chemical Engineering390.5%
- Life Sciences1,65721.2%
- Social Sciences1,44918.5%
- Social Sciences6688.5%
- Psychology3384.3%
- Business, Management and Accounting1441.8%
- Arts and Humanities1401.8%
- Economics, Econometrics and Finance951.2%
- Decision Sciences640.8%
- Health Sciences1,21615.5%
- Medicine93111.9%
- Health Professions1792.3%
- Nursing500.6%
- Veterinary490.6%
- Dentistry60.1%
What does Washington State University specialise in?
Where its research is concentrated relative to its size: Oceanography takes 15.4× the share of its output that it takes of world research.
- OceanographySubfield · 338.1 works15×
- Astronomy and AstrophysicsSubfield · 479.2 works12×
- Environmental ChemistrySubfield · 176.7 works10×
- VeterinaryField · 49.2 works4.6×
- Earth and Planetary SciencesField · 503.9 works4.1×
- Small AnimalsSubfield · 39.5 works4.1×
- GeophysicsSubfield · 102.0 works3.7×
Location quotient, a volume reading rather than an impact one. It surfaces small, lopsided specialities.
Field profile
Location quotient across every field it publishes in: outside the ring is more than an institution of this size would be expected to publish, inside it is less.
Rings at 0.5×, 1× and 2×. Widest outward: Veterinary, 4.6×. Every wedge is a field page.
All 26 fields, with their numbers
- Veterinary4.62×49 works
- Earth and Planetary Sciences4.10×504 works
- Physics and Astronomy3.65×635 works
- Agricultural and Biological Sciences2.11×784 works
- Environmental Science1.48×576 works
- Chemical Engineering1.44×39 works
- Psychology1.42×338 works
- Biochemistry, Genetics and Molecular Biology1.39×582 works
- Pharmacology, Toxicology and Pharmaceutics1.36×38 works
- Nursing1.30×50 works
- Immunology and Microbiology1.27×100 works
- Neuroscience1.21×154 works
- Chemistry0.98×121 works
- Materials Science0.88×241 works
- Health Professions0.87×179 works
- Decision Sciences0.85×64 works
- Engineering0.81×954 works
- Social Sciences0.67×668 works
- Energy0.63×46 works
- Mathematics0.63×58 works
- Medicine0.62×932 works
- Arts and Humanities0.62×140 works
- Business, Management and Accounting0.57×144 works
- Economics, Econometrics and Finance0.57×96 works
- Computer Science0.55×336 works
- Dentistry0.16×6 works
- Veterinary 4.6×
- Earth and Planetary Sciences 4.1×
- Physics and Astronomy 3.6×
- Agricultural and Biological Sciences 2.1×
- Environmental Science 1.5×
- Chemical Engineering 1.4×
- Psychology 1.4×
- Biochemistry, Genetics and Molecular Biology 1.4×
- Pharmacology, Toxicology and Pharmaceutics 1.4×
- Nursing 1.3×
- Immunology and Microbiology 1.3×
- Neuroscience 1.2×
- Chemistry 1.0×
- Materials Science 0.9×
- Health Professions 0.9×
- Decision Sciences 0.8×
- Engineering 0.8×
- Social Sciences 0.7×
- Energy 0.6×
- Mathematics 0.6×
- Medicine 0.6×
- Arts and Humanities 0.6×
- Business, Management and Accounting 0.6×
- Economics, Econometrics and Finance 0.6×
- Computer Science 0.6×
- Dentistry 0.2×
Who are the top researchers at Washington State University?
Ranked on the quality score, Yuehe Lin, Doğan Gürsoy and Susmita Bose lead among researchers whose main affiliation is Washington State University.
- 1
Yuehe Lin
 United States · #2,324 worldwide
83k citations · 741 works
- 2
Doğan Gürsoy
United States · #6,566 worldwide
31k citations · 338 works
- 3
Susmita Bose
United States · #10,298 worldwide
31k citations · 368 works
- 4
Riley E. Dunlap
United States · #13,076 worldwide
35k citations · 208 works
- 5
Amit Kumar Bandyopadhyay
United States · #15,429 worldwide
38k citations · 466 works
- 6
Hanwu Lei
United States · #18,761 worldwide
13k citations · 185 works
- 7
Dan Du
United States · #22,649 worldwide
44k citations · 602 works
- 8
Markus Flury
United States · #22,916 worldwide
18k citations · 294 works
- 9
John Browse
United States · #31,135 worldwide
35k citations · 262 works
- 10
Shichao Ding
United States · #31,411 worldwide
7.1k citations · 126 works
Which keywords describe research at Washington State University?
By fractional works in 2022-now, weighted toward what it does more of than the world: Solar Wind, Climate Change, Hydrological Modeling, Geodetic Measurements, Sea Level Rise, GRACE, groundwater depletion and Ionosphere.
- Grapevine
- Transcriptome Analysis
- Surface Wave
- Host-Pathogen Interactions
- Genome Sequencing
- Tomography
- Particle Acceleration
- Genetic Diversity
- Genetics
- Oxidative Stress
- Public Health
- Coronal Mass Ejections
- Gas Hydrates
- Methane Oxidation
- Machine Learning
- Epidemiology
- Ionosphere
- GRACE
- Geodetic Measurements
- Solar Wind
- Climate Change
- Hydrological Modeling
- Sea Level Rise
- groundwater depletion
- Magnetosphere
- Microbial Communities
- Deep Learning
- Anaerobic
- Sustainability
- Solar Dynamics Observatory
- Mental Health
- Biodiversity
- Invasive Species
- High-Energy Astrophysics
- Genomics
- Genetic Variation
- Circadian Rhythms
- Seismic Noise
- Pathogen Transmission
- Anthocyanins
Size is fractional works in 2022-now in the topics tagged with each word; colour is the word's share of this institution's work against its share of the world's. The 40 words are chosen for being large and distinctive. Each links to the topic it comes from most.
All 40 words, with their numbers
- Climate Change651▲ 3.1×97 topics
- Solar Wind461▲ 65×2 topics
- Hydrological Modeling340▲ 18×5 topics
- Geodetic Measurements332▲ 40×2 topics
- Sea Level Rise329▲ 33×3 topics
- GRACE325▲ 86×1 topic
- groundwater depletion325▲ 86×1 topic
- Ionosphere318▲ 74×1 topic
- Magnetosphere318▲ 74×1 topic
- Epidemiology296◆ 0.95×125 topics
- Microbial Communities198▲ 5.8×10 topics
- Machine Learning183▼ 0.70×77 topics
- Deep Learning157▼ 0.58×73 topics
- Methane Oxidation157▲ 26×2 topics
- Anaerobic157▲ 31×1 topic
- Gas Hydrates157▲ 31×1 topic
- Sustainability154▼ 0.81×79 topics
- Coronal Mass Ejections142▲ 50×1 topic
- Solar Dynamics Observatory142▲ 50×1 topic
- Public Health142▲ 1.24×48 topics
- Mental Health138▲ 1.23×36 topics
- Oxidative Stress136◆ 1.06×59 topics
- Biodiversity96▲ 1.61×31 topics
- Genetics94▲ 1.70×26 topics
- Invasive Species74▲ 2.2×21 topics
- Genetic Diversity69▲ 2.0×20 topics
- High-Energy Astrophysics62▲ 30×1 topic
- Particle Acceleration62▲ 30×1 topic
- Genomics58▲ 2.5×12 topics
- Tomography57▲ 4.1×5 topics
- Genetic Variation52▲ 3.0×9 topics
- Genome Sequencing47▲ 3.8×9 topics
- Circadian Rhythms45▲ 5.3×2 topics
- Host-Pathogen Interactions43▲ 6.7×5 topics
- Seismic Noise40▲ 11×1 topic
- Surface Wave40▲ 11×1 topic
- Pathogen Transmission39▲ 7.2×3 topics
- Transcriptome Analysis39▲ 8.3×3 topics
- Anthocyanins36▲ 6.5×3 topics
- Grapevine33▲ 11×2 topics
Which research topics does Washington State University publish most on?
By volume in 2022-now: Geophysics and Gravity Measurements, Ionosphere and magnetosphere dynamics, Methane Hydrates and Related Phenomena and Solar and Space Plasma Dynamics.
Area is fractional works; colour is the subfield each topic belongs to.
- 1 Geophysics and Gravity Measurements Oceanography 325 works
- 2 Ionosphere and magnetosphere dynamics Astronomy and Astrophysics 318 works
- 3 Methane Hydrates and Related Phenomena Environmental Chemistry 157 works
- 4 Solar and Space Plasma Dynamics Astronomy and Astrophysics 142 works
- 5 Astrophysics and Cosmic Phenomena Nuclear and High Energy Physics 62 works
- 6 Seismic Waves and Analysis Geophysics 40 works
- 7 Horticultural and Viticultural Research Plant Science 28 works
- 8 Sleep and related disorders Experimental and Cognitive Psychology 25 works
- 9 Smart Agriculture and AI Plant Science 25 works
- 10 Plant and animal studies Ecology, Evolution, Behavior and Systematics 24 works
How open and international is its research?
Against the world's own shares: the tick on each track. Both are shares of its output, so they sit on one scale and can be read against each other as well as against the world.
World: 40% of research is openly available.
World: 18% is written across borders.
How has Washington State University's research output changed?
Output in 2022-2025 was 17% lower than in 2018-2021.
The same series as a ribbon: one cell per year, darker for more. The line above answers how much; this answers when.
Its share of all research
Growing output can still be a shrinking share: all of science grows. This is Washington State University as a percentage of every work published that year, 0.030% in 2024.
Fractional works of Washington State University over all fractional works that year. How the balance of science has shifted.
How much of it reaches the world top 10%
Year by year, against all institutions in the same year.
Of each year's output, the share that reached the world's 10% most cited for its field and year. Peak 17.8% in 2020.
Other research institutions in Pullman
- Klar Scientific (United States)
- American Aging Association
- Palouse Discovery Science Center
- Orielle (United States)
Compare Washington State University with
- vs
 Berlin Institute of Health at Charité - Universitätsmedizin Berlin
- vs
 Shaanxi University of Science and Technology
- vs
 Universidade de Vigo
- vs
 University of Southern Queensland
- vs
 University of Stavanger
- vs
 University of Johannesburg
Share Washington State University's ranking



Research measures only: rankings here say nothing about teaching, admissions or student experience. Comparable institutions and collaboration partners have tabs of their own, above.
Discussion
Ask a question or share a note about Washington State University. Posts are plain text and can be reported.