Utah State University
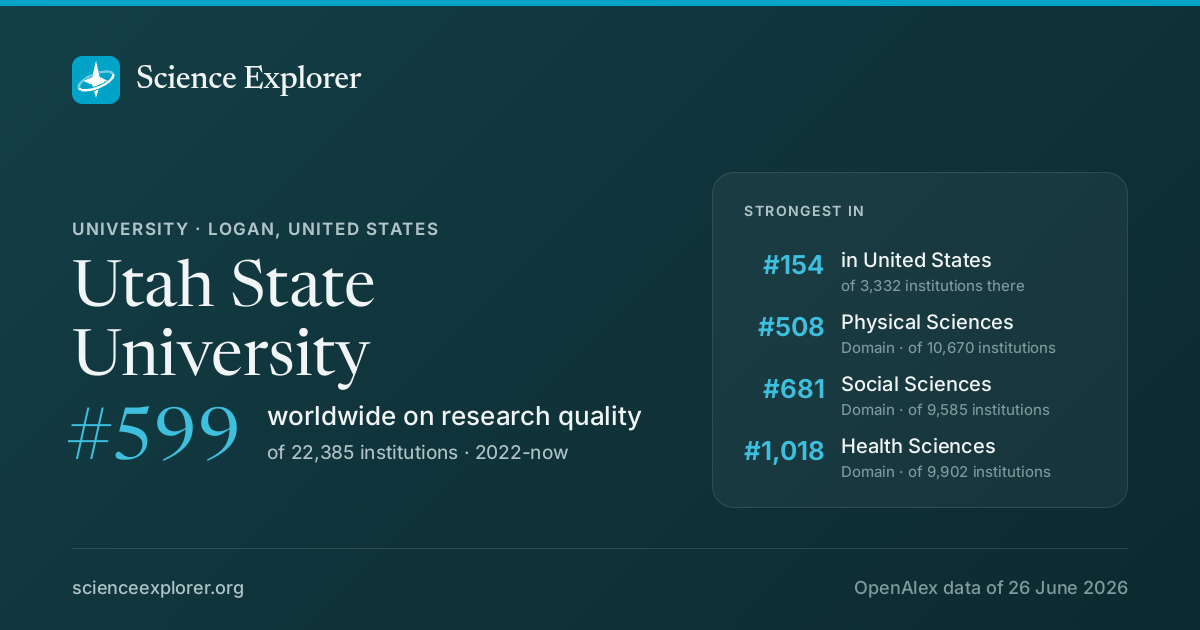
In research, Utah State University stands highest in Physical Sciences (#508 of 10,670 worldwide), Social Sciences (#681 of 9,585 worldwide) and Health Sciences (#1,018 of 9,902 worldwide), 2022-now. Relative to its size it is most specialised in Physical and Theoretical Chemistry, Developmental and Educational Psychology and Nature and Landscape Conservation (Physical and Theoretical Chemistry is 6.4× its share of world research).
- World rank, 2022-now
- #599 of 22,385 · #620 all time
- Rank in United States
- #154 of 3,332
- Research works
- 30k ▼ 14% vs 2018-21
- Citations
- 804k 26.8 per fractional work
- Top-10% rate
- 8.9% all institutions 10.0%
- vs its own fields
- 1.08× 1.00× is exactly expected
- Open access
- 33% world 40%
- International
- 11% world 18%
What is Utah State University known for in research?
The fields where it stands highest, 2022-now, ranked among every institution above the floor in each field.
| Field | World rank | Where that sits | Top-10% rate | Works | All time |
|---|---|---|---|---|---|
| Physical SciencesDomain | #508 of 10,670 | 8.8% | 1,563 | #513 | |
| Social SciencesDomain | #681 of 9,585 | 10.1% | 1,281 | #615 | |
| Health SciencesDomain | #1,018 of 9,902 | 8.5% | 353 | #1142 | |
| Social SciencesField | #696 of 5,988 | 10.4% | 612 | #553 | |
| Agricultural and Biological SciencesField | #387 of 3,157 | 9.3% | 340 | #262 | |
| PsychologyField | #309 of 2,121 | 8.7% | 369 | #420 | |
| Environmental ScienceField | #489 of 3,334 | 9.2% | 371 | #500 | |
| MedicineField | #1,277 of 8,541 | 8.4% | 216 | #1272 | |
| EngineeringField | #910 of 5,901 | 8.2% | 515 | #705 | |
| Life SciencesDomain | #1,031 of 6,403 | 8.9% | 586 | #1147 |
Each strip is that field's whole ranked pool, with the notch where Utah State University sits in it, in the colour of the band that rank falls in. The track under the rate is the rate itself: it carries no average mark, because the average differs by field (from about 6% in Dentistry to 21% in Economics).
Which of those standings moved
The same fields on both windows: where it stood over the whole record, and where it stands in 2022-now. The distance is the story, and it is the one thing the two rank columns above cannot show.
- Physical Sciences#513 #508
- Social Sciences#615 #681
- Health Sciences#1,142 #1,018
- Social Sciences#553 #696
- Agricultural and Biological Sciences#262 #387
- Psychology#420 #309
- Environmental Science#500 #489
- Medicine#1,272 #1,277
- Engineering#705 #910
- Life Sciences#1,147 #1,031
A dot further right is a better standing. Fields it was not ranked in over the whole record are left out.
Which fields of science does Utah State University work in?
In 2022-now, 42% of research at Utah State University is in Physical Sciences, 33% in Social Sciences. Its largest fields are Social Sciences (16%), Engineering (14%), Environmental Science (10%). It does 1.3× the world's share of Social Sciences.
Each ring splits the one inside it: the four domains of science, their fields, their subfields. Size is fractional works in 2022-now. Every slice is a page; the interactive view zooms down to single topics and colours each by how much more of it this institution does than the world.
Its 4 domains and 26 fields, with their numbers
- Physical Sciences1,86242.1%
- Engineering61513.9%
- Environmental Science45710.3%
- Computer Science3217.3%
- Earth and Planetary Sciences1333.0%
- Physics and Astronomy922.1%
- Chemistry831.9%
- Materials Science631.4%
- Mathematics591.3%
- Energy290.7%
- Chemical Engineering100.2%
- Social Sciences1,46633.1%
- Social Sciences70115.8%
- Psychology4199.5%
- Arts and Humanities1272.9%
- Economics, Econometrics and Finance872.0%
- Business, Management and Accounting701.6%
- Decision Sciences611.4%
- Life Sciences69215.6%
- Health Sciences4089.2%
- Medicine2525.7%
- Health Professions1282.9%
- Nursing160.4%
- Veterinary110.3%
- Dentistry10.0%
What does Utah State University specialise in?
Where its research is concentrated relative to its size: Physical and Theoretical Chemistry takes 6.4× the share of its output that it takes of world research.
- Physical and Theoretical ChemistrySubfield · 22.5 works6.4×
- Developmental and Educational PsychologySubfield · 94.8 works4.7×
- Nature and Landscape ConservationSubfield · 43.6 works4.1×
- Safety ResearchSubfield · 50.8 works4.1×
- Applied PsychologySubfield · 24.2 works3.8×
Location quotient, a volume reading rather than an impact one. It surfaces small, lopsided specialities.
Field profile
Location quotient across every field it publishes in: outside the ring is more than an institution of this size would be expected to publish, inside it is less.
Rings at 0.5×, 1× and 2×. Widest outward: Psychology, 3.1×. Every wedge is a field page.
All 26 fields, with their numbers
- Psychology3.10×419 works
- Environmental Science2.08×457 works
- Earth and Planetary Sciences1.92×133 works
- Agricultural and Biological Sciences1.90×400 works
- Veterinary1.89×11 works
- Decision Sciences1.44×61 works
- Neuroscience1.38×99 works
- Social Sciences1.25×701 works
- Chemistry1.20×83 works
- Mathematics1.14×59 works
- Health Professions1.09×128 works
- Arts and Humanities1.00×127 works
- Computer Science0.93×321 works
- Engineering0.93×615 works
- Physics and Astronomy0.93×92 works
- Economics, Econometrics and Finance0.92×87 works
- Nursing0.73×16 works
- Biochemistry, Genetics and Molecular Biology0.72×171 works
- Energy0.71×29 works
- Chemical Engineering0.66×10 works
- Business, Management and Accounting0.49×70 works
- Pharmacology, Toxicology and Pharmaceutics0.46×7 works
- Materials Science0.41×63 works
- Immunology and Microbiology0.34×15 works
- Medicine0.30×252 works
- Dentistry0.06×1 works
- Psychology 3.1×
- Environmental Science 2.1×
- Earth and Planetary Sciences 1.9×
- Agricultural and Biological Sciences 1.9×
- Veterinary 1.9×
- Decision Sciences 1.4×
- Neuroscience 1.4×
- Social Sciences 1.2×
- Chemistry 1.2×
- Mathematics 1.1×
- Health Professions 1.1×
- Arts and Humanities 1.0×
- Computer Science 0.9×
- Engineering 0.9×
- Physics and Astronomy 0.9×
- Economics, Econometrics and Finance 0.9×
- Nursing 0.7×
- Biochemistry, Genetics and Molecular Biology 0.7×
- Energy 0.7×
- Chemical Engineering 0.7×
- Business, Management and Accounting 0.5×
- Pharmacology, Toxicology and Pharmaceutics 0.5×
- Materials Science 0.4×
- Immunology and Microbiology 0.3×
- Medicine 0.3×
- Dentistry 0.1×
Who are the top researchers at Utah State University?
Ranked on the quality score, Peter B. Adler, James A. Lutz and Tianbiao Leo Liu lead among researchers whose main affiliation is Utah State University.
- 1
Peter B. Adler
 United States · #20,478 worldwide
25k citations · 303 works
- 2
James A. Lutz
United States · #34,124 worldwide
12k citations · 252 works
- 3
Tianbiao Leo Liu
United States · #36,300 worldwide
12k citations · 228 works
- 4
Tal Avgar
United States · #63,302 worldwide
6.5k citations · 110 works
- 5
Wei Ren
United States · #63,951 worldwide
18k citations · 88 works
- 6
Peter D. Howe
United States · #85,027 worldwide
6.5k citations · 130 works
- 7
Trisha B. Atwood
United States · #87,676 worldwide
8.8k citations · 90 works
- 8
Romain Villoutreix
United States · #97,845 worldwide
1.8k citations · 305 works
- 9
Zachariah Gompert
United States · #112,629 worldwide
9.1k citations · 208 works
- 10
Alexander I. Boldyrev
United States · #124,544 worldwide
29k citations · 558 works
Which keywords describe research at Utah State University?
By fractional works in 2022-now, weighted toward what it does more of than the world: Climate Change, Invasive Species, Mental Health, Biodiversity, Habitat Fragmentation, Resilience, Well-being and Emotion Regulation.
- Pollinator Decline
- Species Richness
- Behavioral Interventions
- Language Development
- Experiential Learning
- Water Resources
- Sediment Transport
- Ecosystem Resilience
- Teacher Preparation
- Global Warming
- Global Change
- Gender Differences
- Habitat Fragmentation
- Emotion Regulation
- Depression
- Resilience
- Education
- Invasive Species
- Biodiversity
- Mental Health
- Climate Change
- Machine Learning
- Sustainability
- Remote Sensing
- Quality of Life
- Well-being
- Conservation
- Social Support
- Ecosystem Services
- STEM Education
- Student Engagement
- Ecosystem
- Evidence-Based Practice
- Hydrological Modeling
- Self-Regulation
- Model Evaluation
- Learning Analytics
- Special Education
- Engineering Education
- Plant-Animal Interactions
Size is fractional works in 2022-now in the topics tagged with each word; colour is the word's share of this institution's work against its share of the world's. The 40 words are chosen for being large and distinctive. Each links to the topic it comes from most.
All 40 words, with their numbers
- Climate Change352▲ 2.9×96 topics
- Mental Health161▲ 2.5×38 topics
- Machine Learning126▼ 0.86×75 topics
- Biodiversity122▲ 3.6×29 topics
- Sustainability120◆ 1.11×71 topics
- Invasive Species118▲ 6.3×21 topics
- Remote Sensing96▲ 1.77×33 topics
- Education85◆ 1.12×57 topics
- Quality of Life80▲ 1.25×33 topics
- Resilience79▲ 3.6×16 topics
- Well-being72▲ 4.2×13 topics
- Depression71▲ 1.83×20 topics
- Conservation69▲ 3.6×23 topics
- Emotion Regulation67▲ 4.8×9 topics
- Social Support67▲ 2.8×14 topics
- Habitat Fragmentation66▲ 6.9×4 topics
- Ecosystem Services66▲ 3.8×12 topics
- Gender Differences61▲ 3.7×14 topics
- STEM Education60▲ 3.0×10 topics
- Global Change58▲ 5.0×7 topics
- Student Engagement58▲ 3.3×13 topics
- Global Warming56▲ 2.9×13 topics
- Ecosystem48▲ 10×4 topics
- Teacher Preparation45▲ 13×4 topics
- Evidence-Based Practice44▲ 7.5×7 topics
- Ecosystem Resilience42▲ 6.1×5 topics
- Hydrological Modeling42▲ 3.9×5 topics
- Sediment Transport41▲ 5.8×5 topics
- Self-Regulation40▲ 5.1×6 topics
- Water Resources40▲ 3.7×9 topics
- Model Evaluation35▲ 6.2×2 topics
- Experiential Learning35▲ 15×6 topics
- Learning Analytics34▲ 6.4×2 topics
- Language Development33▲ 6.0×5 topics
- Special Education33▲ 13×4 topics
- Behavioral Interventions31▲ 8.6×2 topics
- Engineering Education30▲ 7.8×4 topics
- Species Richness28▲ 9.9×2 topics
- Plant-Animal Interactions28▲ 8.0×1 topic
- Pollinator Decline28▲ 8.0×1 topic
Which research topics does Utah State University publish most on?
By volume in 2022-now: Plant and animal studies, Diverse Educational Innovations Studies, Behavioral and Psychological Studies and Rangeland and Wildlife Management.
Area is fractional works; colour is the subfield each topic belongs to.
- 1 Plant and animal studies Ecology, Evolution, Behavior and Systematics 28 works
- 2 Diverse Educational Innovations Studies General Agricultural and Biological Sciences 26 works
- 3 Behavioral and Psychological Studies Developmental and Educational Psychology 26 works
- 4 Rangeland and Wildlife Management Ecology 25 works
- 5 Teaching and Learning Programming Computer Science Applications 22 works
- 6 Hydrology and Watershed Management Studies Water Science and Technology 22 works
- 7 Ecology and Vegetation Dynamics Studies Nature and Landscape Conservation 21 works
- 8 Autism Spectrum Disorder Research Cognitive Neuroscience 20 works
- 9 Food Security and Health in Diverse Populations General Health Professions 20 works
- 10 Child and Adolescent Psychosocial and Emotional Development Clinical Psychology 20 works
How open and international is its research?
Against the world's own shares: the tick on each track. Both are shares of its output, so they sit on one scale and can be read against each other as well as against the world.
World: 40% of research is openly available.
World: 18% is written across borders.
How has Utah State University's research output changed?
Output in 2022-2025 was 14% lower than in 2018-2021.
The same series as a ribbon: one cell per year, darker for more. The line above answers how much; this answers when.
Its share of all research
Growing output can still be a shrinking share: all of science grows. This is Utah State University as a percentage of every work published that year, 0.018% in 2024.
Fractional works of Utah State University over all fractional works that year. How the balance of science has shifted.
How much of it reaches the world top 10%
Year by year, against all institutions in the same year.
Of each year's output, the share that reached the world's 10% most cited for its field and year. Peak 13.5% in 1990.
Other research institutions in Logan
- Autonomous Solutions (United States)
- Frontier Scientific (United States)
- Wasatch Photonics (United States)
- National Agriculture in the Classroom
Compare Utah State University with
- vs Syracuse University
- vs Clemson University
- vs University of South Florida
- vs
 Indian Institute of Technology Delhi
- vs Wayne State University
- vs University at Albany, State University of New York
Share Utah State University's ranking



Research measures only: rankings here say nothing about teaching, admissions or student experience. Comparable institutions and collaboration partners have tabs of their own, above.
Discussion
Ask a question or share a note about Utah State University. Posts are plain text and can be reported.