Binus University
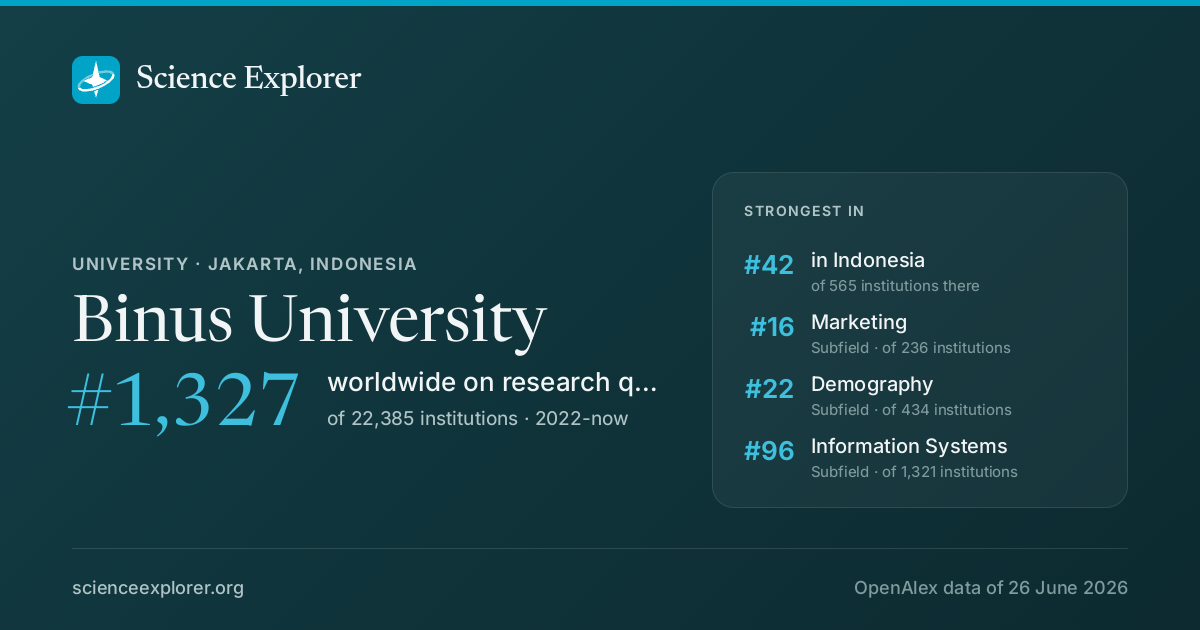
In research, Binus University stands highest in Demography (#22 of 434 worldwide), Marketing (#16 of 236 worldwide) and Information Systems (#96 of 1,321 worldwide), 2022-now. Relative to its size it is most specialised in Information Systems and Management, Life-span and Life-course Studies and Marketing (Information Systems and Management is 14.9× its share of world research).
- World rank, 2022-now
- #1,327 of 22,385 · #2,107 all time
- Rank in Indonesia
- #42 of 565
- Research works
- 22k ▲ 130% vs 2018-21
- Citations
- 78k 3.6 per fractional work
- Top-10% rate
- 6.5% all institutions 10.0%
- vs its own fields
- 0.71× 1.00× is exactly expected
- Open access
- 61% world 40%
- International
- 6% world 18%
What is Binus University known for in research?
The fields where it stands highest, 2022-now, ranked among every institution above the floor in each field.
| Field | World rank | Where that sits | Top-10% rate | Works | All time |
|---|---|---|---|---|---|
| DemographySubfield | #22 of 434 | 15.1% | 446 | #116 | |
| MarketingSubfield | #16 of 236 | 9.1% | 539 | #148 | |
| Information SystemsSubfield | #96 of 1,321 | 10.6% | 1,123 | #324 | |
| Health Information ManagementSubfield | #10 of 120 | 10.3% | 185 | #67 | |
| Social SciencesDomain | #950 of 9,585 | 7.3% | 6,013 | #1549 | |
| Business, Management and AccountingField | #263 of 2,581 | 7.3% | 2,032 | #636 | |
| Social SciencesField | #683 of 5,988 | 9.4% | 2,321 | #1184 | |
| Computer ScienceField | #561 of 4,417 | 7.2% | 2,726 | #937 | |
| Physical SciencesDomain | #1,817 of 10,670 | 6.0% | 4,121 | #2459 | |
| Agricultural and Biological SciencesField | #722 of 3,157 | 6.8% | 383 | #1745 |
Each strip is that field's whole ranked pool, with the notch where Binus University sits in it, in the colour of the band that rank falls in. The track under the rate is the rate itself: it carries no average mark, because the average differs by field (from about 6% in Dentistry to 21% in Economics).
Which of those standings moved
The same fields on both windows: where it stood over the whole record, and where it stands in 2022-now. The distance is the story, and it is the one thing the two rank columns above cannot show.
- Demography#116 #22
- Marketing#148 #16
- Information Systems#324 #96
- Health Information Management#67 #10
- Social Sciences#1,549 #950
- Business, Management and Accounting#636 #263
- Social Sciences#1,184 #683
- Computer Science#937 #561
- Physical Sciences#2,459 #1,817
- Agricultural and Biological Sciences#1,745 #722
A dot further right is a better standing. Fields it was not ranked in over the whole record are left out.
Which fields of science does Binus University work in?
In 2022-now, 53% of research at Binus University is in Social Sciences, 36% in Physical Sciences. Its largest fields are Computer Science (24%), Social Sciences (20%), Business, Management and Accounting (18%). It does 2.2× the world's share of Social Sciences.
Each ring splits the one inside it: the four domains of science, their fields, their subfields. Size is fractional works in 2022-now. Every slice is a page; the interactive view zooms down to single topics and colours each by how much more of it this institution does than the world.
Its 4 domains and 26 fields, with their numbers
- Social Sciences6,72453.3%
- Social Sciences2,55920.3%
- Business, Management and Accounting2,27918.1%
- Decision Sciences8406.7%
- Psychology4263.4%
- Economics, Econometrics and Finance3722.9%
- Arts and Humanities2482.0%
- Physical Sciences4,55836.1%
- Computer Science3,00223.8%
- Engineering9687.7%
- Environmental Science3793.0%
- Energy450.4%
- Earth and Planetary Sciences380.3%
- Chemistry360.3%
- Materials Science330.3%
- Mathematics330.3%
- Physics and Astronomy200.2%
- Chemical Engineering40.0%
- Health Sciences7536.0%
- Health Professions3462.7%
- Medicine3462.7%
- Nursing510.4%
- Dentistry80.1%
- Veterinary20.0%
- Life Sciences5824.6%
What does Binus University specialise in?
Where its research is concentrated relative to its size: Information Systems and Management takes 14.9× the share of its output that it takes of world research.
- Information Systems and ManagementSubfield · 535.5 works15×
- Life-span and Life-course StudiesSubfield · 25.9 works12×
- MarketingSubfield · 603.8 works11×
- Management Information SystemsSubfield · 421.4 works8.2×
- Decision SciencesField · 840.2 works6.9×
- Health Information ManagementSubfield · 210.0 works6.5×
- Human Factors and ErgonomicsSubfield · 89.9 works6.4×
- ConservationSubfield · 74.3 works6.2×
Location quotient, a volume reading rather than an impact one. It surfaces small, lopsided specialities.
Field profile
Location quotient across every field it publishes in: outside the ring is more than an institution of this size would be expected to publish, inside it is less.
Rings at 0.5×, 1× and 2×. Widest outward: Decision Sciences, 6.9×. Every wedge is a field page.
All 26 fields, with their numbers
- Decision Sciences6.89×840 works
- Business, Management and Accounting5.60×2,279 works
- Computer Science3.06×3,002 works
- Social Sciences1.60×2,559 works
- Economics, Econometrics and Finance1.38×372 works
- Psychology1.11×426 works
- Health Professions1.04×346 works
- Nursing0.83×51 works
- Agricultural and Biological Sciences0.69×416 works
- Arts and Humanities0.68×248 works
- Environmental Science0.60×379 works
- Engineering0.51×968 works
- Energy0.38×45 works
- Neuroscience0.31×64 works
- Pharmacology, Toxicology and Pharmaceutics0.24×11 works
- Mathematics0.22×33 works
- Earth and Planetary Sciences0.19×38 works
- Chemistry0.18×36 works
- Medicine0.14×346 works
- Biochemistry, Genetics and Molecular Biology0.13×85 works
- Dentistry0.13×8 works
- Veterinary0.13×2 works
- Chemical Engineering0.08×4 works
- Materials Science0.08×33 works
- Physics and Astronomy0.07×20 works
- Immunology and Microbiology0.05×7 works
- Decision Sciences 6.9×
- Business, Management and Accounting 5.6×
- Computer Science 3.1×
- Social Sciences 1.6×
- Economics, Econometrics and Finance 1.4×
- Psychology 1.1×
- Health Professions 1.0×
- Nursing 0.8×
- Agricultural and Biological Sciences 0.7×
- Arts and Humanities 0.7×
- Environmental Science 0.6×
- Engineering 0.5×
- Energy 0.4×
- Neuroscience 0.3×
- Pharmacology, Toxicology and Pharmaceutics 0.2×
- Mathematics 0.2×
- Earth and Planetary Sciences 0.2×
- Chemistry 0.2×
- Medicine 0.1×
- Biochemistry, Genetics and Molecular Biology 0.1×
- Dentistry 0.1×
- Veterinary 0.1×
- Chemical Engineering 0.1×
- Materials Science 0.1×
- Physics and Astronomy 0.1×
- Immunology and Microbiology 0.1×
Who are the top researchers at Binus University?
Ranked on the quality score, Mochammad Fahlevi, Anak Agung Ngurah Perwira Redi and M. Habiby lead among researchers whose main affiliation is Binus University.
- 1
Mochammad Fahlevi
 Indonesia · #281,560 worldwide
4.3k citations · 253 works
- 2
Anak Agung Ngurah Perwira Redi
Indonesia · #684,974 worldwide
3.5k citations · 155 works
- 3
M. Habiby
Indonesia · #904,779 worldwide
4.3k citations · 16 works
- 4
Satria Fadil Persada
Indonesia · #1,043,559 worldwide
3.7k citations · 255 works
- 5
Moch Faisal Karim
Indonesia · #1,253,017 worldwide
495 citations · 85 works
- 6
Leonardus W.W. Mihardjo
Indonesia · #1,346,179 worldwide
1.4k citations · 40 works
- 7
Rano Kartono Rahim
Indonesia · #1,551,239 worldwide
157 citations · 40 works
- 8
Tjeng Wawan Cenggoro
Indonesia · #1,562,969 worldwide
1.7k citations · 134 works
- 9
Rezzy Eko Caraka
Indonesia · #1,901,682 worldwide
3k citations · 155 works
- 10
Faisal Binsar
Indonesia · #1,934,140 worldwide
181 citations · 43 works
Which keywords describe research at Binus University?
By fractional works in 2022-now, weighted toward what it does more of than the world: Social Media, E-commerce, Machine Learning, Supply Chain Management, Online Shopping, Financial Performance, Technology Acceptance Model and Data Mining.
- Blockchain
- Electronic Word-of-Mouth
- User-Generated Content
- Service Quality
- Healthcare
- Corporate Governance
- Economic Impact
- Indonesia
- E-Learning
- Partial Least Squares
- Education
- Neural Networks
- User Satisfaction
- Consumer Behavior
- Technology Acceptance Model
- Financial Performance
- Sustainability
- Supply Chain Management
- Deep Learning
- Social Media
- Machine Learning
- E-commerce
- Artificial Intelligence
- Online Shopping
- Data Mining
- Big Data
- Internet of Things
- COVID-19
- Structural Equation Modeling
- Information Systems
- Consumer Trust
- Pandemic
- Customer Satisfaction
- Educational Technology
- Digital Marketing
- SMEs
- UMKM
- Digital Transformation
- Consumer Engagement
- Information Technology
Size is fractional works in 2022-now in the topics tagged with each word; colour is the word's share of this institution's work against its share of the world's. The 40 words are chosen for being large and distinctive. Each links to the topic it comes from most.
All 40 words, with their numbers
- Machine Learning1,541▲ 3.7×90 topics
- Social Media1,297▲ 7.4×31 topics
- E-commerce1,236▲ 17×11 topics
- Deep Learning1,012▲ 2.3×82 topics
- Artificial Intelligence798▲ 4.4×54 topics
- Supply Chain Management757▲ 6.7×24 topics
- Online Shopping697▲ 31×2 topics
- Sustainability672▲ 2.2×85 topics
- Data Mining654▲ 7.1×22 topics
- Financial Performance646▲ 9.1×13 topics
- Big Data642▲ 5.3×33 topics
- Technology Acceptance Model629▲ 32×2 topics
- Internet of Things618▲ 5.7×30 topics
- Consumer Behavior614▲ 7.8×18 topics
- COVID-19576▲ 3.5×23 topics
- User Satisfaction562▲ 23×4 topics
- Structural Equation Modeling543▲ 22×6 topics
- Neural Networks541▲ 2.8×37 topics
- Information Systems531▲ 24×7 topics
- Education525▲ 2.4×64 topics
- Consumer Trust517▲ 43×1 topic
- Partial Least Squares517▲ 43×1 topic
- Pandemic514▲ 4.1×13 topics
- E-Learning513▲ 4.2×21 topics
- Customer Satisfaction498▲ 12×8 topics
- Indonesia477▲ 8.6×5 topics
- Educational Technology455▲ 3.1×35 topics
- Economic Impact451▲ 6.7×9 topics
- Digital Marketing426▲ 8.7×5 topics
- Corporate Governance424▲ 4.6×23 topics
- SMEs417▲ 10×4 topics
- Healthcare416▲ 2.9×21 topics
- UMKM402▲ 12×1 topic
- Service Quality385▲ 11×7 topics
- Digital Transformation377▲ 5.5×22 topics
- User-Generated Content370▲ 22×2 topics
- Consumer Engagement369▲ 24×1 topic
- Electronic Word-of-Mouth369▲ 24×1 topic
- Information Technology316▲ 5.3×20 topics
- Blockchain287▲ 10×2 topics
Which research topics does Binus University publish most on?
By volume in 2022-now: Technology Adoption and User Behaviour, SMEs Development and Digital Marketing, Digital Marketing and Social Media and Consumer Behavior and Marketing Influence.
Area is fractional works; colour is the subfield each topic belongs to.
- 1 Technology Adoption and User Behaviour Information Systems and Management 517 works
- 2 SMEs Development and Digital Marketing Demography 402 works
- 3 Digital Marketing and Social Media Sociology and Political Science 369 works
- 4 Consumer Behavior and Marketing Influence Marketing 180 works
- 5 Blockchain Technology in Education and Learning Information Systems 176 works
- 6 Information Retrieval and Data Mining Information Systems 169 works
- 7 FinTech, Crowdfunding, Digital Finance Management Information Systems 136 works
- 8 Consumer Retail Behavior Studies Marketing 128 works
- 9 Edcuational Technology Systems Artificial Intelligence 126 works
- 10 Sentiment Analysis and Opinion Mining Artificial Intelligence 125 works
How open and international is its research?
Against the world's own shares: the tick on each track. Both are shares of its output, so they sit on one scale and can be read against each other as well as against the world.
World: 40% of research is openly available.
World: 18% is written across borders.
How has Binus University's research output changed?
Output in 2022-2025 was 130% higher than in 2018-2021.
The same series as a ribbon: one cell per year, darker for more. The line above answers how much; this answers when.
Its share of all research
Growing output can still be a shrinking share: all of science grows. This is Binus University as a percentage of every work published that year, 0.050% in 2024.
Fractional works of Binus University over all fractional works that year. How the balance of science has shifted.
How much of it reaches the world top 10%
Year by year, against all institutions in the same year.
Of each year's output, the share that reached the world's 10% most cited for its field and year. Peak 10.2% in 2014.
Other research institutions in Jakarta
- State University of Jakarta
- Tarumanagara University
- Universitas Trisakti
- Mercu Buana University
- Universitas Nahdlatul Ulama Indonesia
- Indonesian Institute of Sciences
- Universitas Indraprasta PGRI
- Badan Penelitian dan Pengembangan Kesehatan


Share Binus University's ranking



Research measures only: rankings here say nothing about teaching, admissions or student experience. Comparable institutions and collaboration partners have tabs of their own, above.
Discussion
Ask a question or share a note about Binus University. Posts are plain text and can be reported.