Tampere University
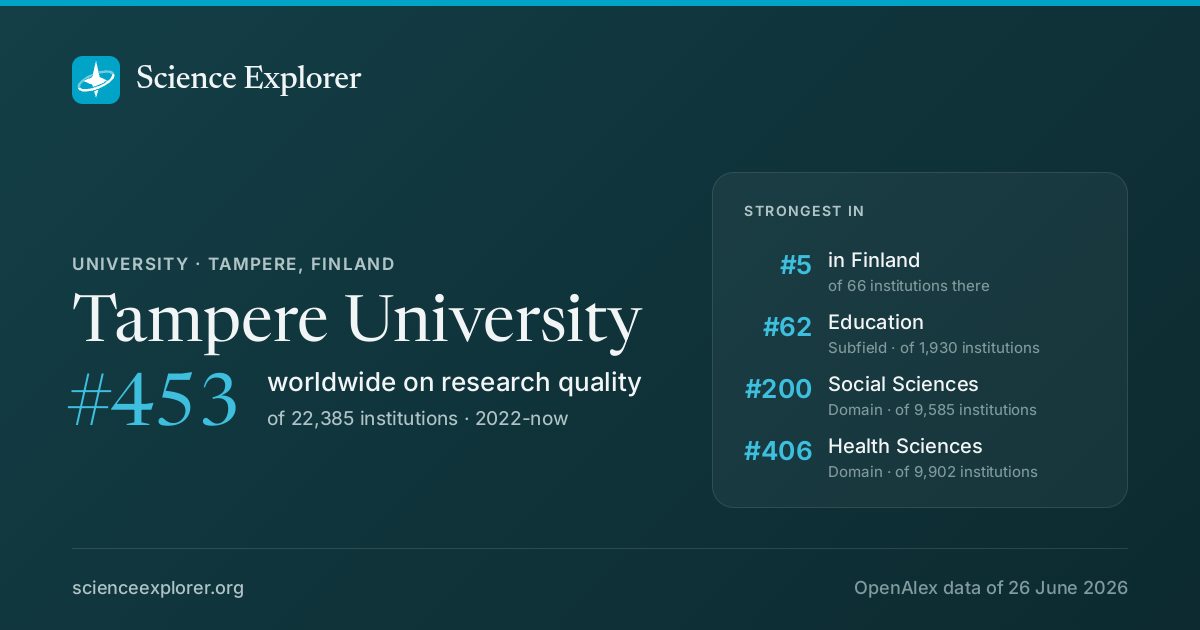
In research, Tampere University stands highest in Social Sciences (#200 of 9,585 worldwide), Social Sciences (#161 of 5,988 worldwide) and Education (#62 of 1,930 worldwide), 2022-now. Relative to its size it is most specialised in Public Administration, Human-Computer Interaction and Hardware and Architecture (Public Administration is 9.7× its share of world research).
- World rank, 2022-now
- #453 of 22,385 · #514 all time
- Rank in Finland
- #5 of 66
- Research works
- 23k ▲ 14% vs 2018-21
- Citations
- 512k 21.8 per fractional work
- Top-10% rate
- 12.5% all institutions 10.0%
- vs its own fields
- 1.10× 1.00× is exactly expected
- Open access
- 51% world 40%
- International
- 24% world 18%
What is Tampere University known for in research?
The fields where it stands highest, 2022-now, ranked among every institution above the floor in each field.
| Field | World rank | Where that sits | Top-10% rate | Works | All time |
|---|---|---|---|---|---|
| Social SciencesDomain | #200 of 9,585 | 15.2% | 2,602 | #268 | |
| Social SciencesField | #161 of 5,988 | 14.4% | 1,522 | #229 | |
| EducationSubfield | #62 of 1,930 | 10.1% | 539 | #72 | |
| Health SciencesDomain | #406 of 9,902 | 12.0% | 1,109 | #465 | |
| MedicineField | #405 of 8,541 | 12.3% | 859 | #447 | |
| Physical SciencesDomain | #627 of 10,670 | 10.7% | 2,352 | #460 | |
| Sociology and Political ScienceSubfield | #184 of 2,526 | 18.0% | 374 | #246 | |
| EngineeringField | #471 of 5,901 | 11.1% | 1,123 | #634 | |
| Political Science and International RelationsSubfield | #102 of 1,187 | 19.9% | 224 | #184 | |
| Business, Management and AccountingField | #239 of 2,581 | 18.4% | 242 | #314 |
Each strip is that field's whole ranked pool, with the notch where Tampere University sits in it, in the colour of the band that rank falls in. The track under the rate is the rate itself: it carries no average mark, because the average differs by field (from about 6% in Dentistry to 21% in Economics).
Which of those standings moved
The same fields on both windows: where it stood over the whole record, and where it stands in 2022-now. The distance is the story, and it is the one thing the two rank columns above cannot show.
- Social Sciences#268 #200
- Social Sciences#229 #161
- Education#72 #62
- Health Sciences#465 #406
- Medicine#447 #405
- Physical Sciences#460 #627
- Sociology and Political Science#246 #184
- Engineering#634 #471
- Political Science and International Relations#184 #102
- Business, Management and Accounting#314 #239
A dot further right is a better standing. Fields it was not ranked in over the whole record are left out.
Which fields of science does Tampere University work in?
In 2022-now, 41% of research at Tampere University is in Social Sciences, 36% in Physical Sciences. Its largest fields are Social Sciences (24%), Engineering (17%), Medicine (14%). It does 1.7× the world's share of Social Sciences.
Each ring splits the one inside it: the four domains of science, their fields, their subfields. Size is fractional works in 2022-now. Every slice is a page; the interactive view zooms down to single topics and colours each by how much more of it this institution does than the world.
Its 4 domains and 26 fields, with their numbers
- Social Sciences2,87040.9%
- Social Sciences1,69724.2%
- Psychology4165.9%
- Arts and Humanities3264.7%
- Business, Management and Accounting2593.7%
- Decision Sciences891.3%
- Economics, Econometrics and Finance831.2%
- Physical Sciences2,54136.2%
- Engineering1,20017.1%
- Computer Science73210.4%
- Environmental Science1622.3%
- Materials Science1592.3%
- Physics and Astronomy1291.8%
- Earth and Planetary Sciences410.6%
- Chemistry380.5%
- Mathematics370.5%
- Energy360.5%
- Chemical Engineering90.1%
- Health Sciences1,23617.6%
- Medicine96213.7%
- Health Professions2353.3%
- Nursing240.3%
- Dentistry130.2%
- Veterinary20.0%
- Life Sciences3655.2%
What does Tampere University specialise in?
Where its research is concentrated relative to its size: Public Administration takes 9.7× the share of its output that it takes of world research.
- Public AdministrationSubfield · 36.5 works9.7×
- Human-Computer InteractionSubfield · 83.1 works5.7×
- Hardware and ArchitectureSubfield · 31.3 works4.0×
- CommunicationSubfield · 72.1 works3.8×
- Signal ProcessingSubfield · 58.8 works2.8×
- EducationSubfield · 572.6 works2.7×
- Language and LinguisticsSubfield · 74.1 works2.4×
Location quotient, a volume reading rather than an impact one. It surfaces small, lopsided specialities.
Field profile
Location quotient across every field it publishes in: outside the ring is more than an institution of this size would be expected to publish, inside it is less.
Rings at 0.5×, 1× and 2×. Widest outward: Psychology, 1.9×. Every wedge is a field page.
All 26 fields, with their numbers
- Psychology1.95×416 works
- Social Sciences1.91×1,697 works
- Arts and Humanities1.61×326 works
- Computer Science1.34×732 works
- Decision Sciences1.31×89 works
- Health Professions1.27×235 works
- Business, Management and Accounting1.15×259 works
- Engineering1.14×1,200 works
- Neuroscience0.97×110 works
- Physics and Astronomy0.83×129 works
- Medicine0.71×962 works
- Nursing0.71×24 works
- Materials Science0.65×159 works
- Energy0.56×36 works
- Economics, Econometrics and Finance0.55×83 works
- Biochemistry, Genetics and Molecular Biology0.50×187 works
- Environmental Science0.46×162 works
- Mathematics0.44×37 works
- Dentistry0.39×13 works
- Immunology and Microbiology0.38×27 works
- Chemical Engineering0.37×9 works
- Earth and Planetary Sciences0.37×41 works
- Chemistry0.34×38 works
- Pharmacology, Toxicology and Pharmaceutics0.21×5 works
- Veterinary0.19×2 works
- Agricultural and Biological Sciences0.11×37 works
- Psychology 1.9×
- Social Sciences 1.9×
- Arts and Humanities 1.6×
- Computer Science 1.3×
- Decision Sciences 1.3×
- Health Professions 1.3×
- Business, Management and Accounting 1.1×
- Engineering 1.1×
- Neuroscience 1.0×
- Physics and Astronomy 0.8×
- Medicine 0.7×
- Nursing 0.7×
- Materials Science 0.7×
- Energy 0.6×
- Economics, Econometrics and Finance 0.6×
- Biochemistry, Genetics and Molecular Biology 0.5×
- Environmental Science 0.5×
- Mathematics 0.4×
- Dentistry 0.4×
- Immunology and Microbiology 0.4×
- Chemical Engineering 0.4×
- Earth and Planetary Sciences 0.4×
- Chemistry 0.3×
- Pharmacology, Toxicology and Pharmaceutics 0.2×
- Veterinary 0.2×
- Agricultural and Biological Sciences 0.1×
Who are the top researchers at Tampere University?
Ranked on the quality score, Juho Hamari, Atte Oksanen and Kalevi Korpela lead among researchers whose main affiliation is Tampere University.
- 1
Juho Hamari
 Finland · #14,190 worldwide
38k citations · 483 works
- 2
Atte Oksanen
Finland · #19,618 worldwide
9k citations · 324 works
- 3
Kalevi Korpela
Finland · #24,259 worldwide
14k citations · 120 works
- 4
Iina Savolainen
Finland · #37,376 worldwide
3.1k citations · 145 works
- 5
Ulla M. Kinnunen
Finland · #46,505 worldwide
17k citations · 273 works
- 6
Leena Aarikka‐Stenroos
Finland · #62,981 worldwide
6.2k citations · 109 works
- 7
Tiina Soini
Finland · #63,400 worldwide
4.3k citations · 135 works
- 8
Markus Kaakinen
Finland · #66,275 worldwide
2.9k citations · 110 works
- 9
Anu Sirola
Finland · #69,161 worldwide
1.6k citations · 63 works
- 10
Jessica de Bloom
Finland · #80,387 worldwide
4.3k citations · 107 works
Which keywords describe research at Tampere University?
By fractional works in 2022-now, weighted toward what it does more of than the world: Ethics, Communication, Pedagogy, Qualitative Research, Phenomenology, Healthcare, Social Sciences and Family Dynamics.
- Online Gaming
- Video Games
- Participatory Design
- Institutional Theory
- Online Communication
- Beamforming
- Emotion
- Feminism
- Student Engagement
- Neoliberalism
- Social Interaction
- Neural Networks
- Social Media
- Machine Learning
- Globalization
- Work Environment
- Social Sciences
- Pedagogy
- Qualitative Research
- Ethics
- Education
- Healthcare
- Communication
- Phenomenology
- Family Dynamics
- Deep Learning
- Epidemiology
- Sustainability
- Mental Health
- Public Health
- Big Data
- Energy Efficiency
- Learning Outcomes
- Embodiment
- Intrinsic Motivation
- Cultural Competence
- Stereotypes
- Public Opinion
- User Experience
- Esports
Size is fractional works in 2022-now in the topics tagged with each word; colour is the word's share of this institution's work against its share of the world's. The 40 words are chosen for being large and distinctive. Each links to the topic it comes from most.
All 40 words, with their numbers
- Education478▲ 4.0×69 topics
- Ethics463▲ 13×36 topics
- Healthcare453▲ 5.7×27 topics
- Qualitative Research419▲ 7.0×24 topics
- Communication406▲ 18×14 topics
- Pedagogy404▲ 11×17 topics
- Phenomenology392▲ 52×5 topics
- Social Sciences390▲ 38×11 topics
- Family Dynamics380▲ 43×2 topics
- Work Environment379▲ 306×1 topic
- Deep Learning252◆ 1.04×72 topics
- Globalization234▲ 1.69×101 topics
- Epidemiology206▼ 0.74×123 topics
- Machine Learning196▼ 0.84×79 topics
- Sustainability194◆ 1.13×77 topics
- Social Media146▲ 1.50×31 topics
- Mental Health142▲ 1.42×39 topics
- Neural Networks117◆ 1.08×39 topics
- Public Health115◆ 1.13×51 topics
- Social Interaction113▲ 4.1×11 topics
- Big Data112▲ 1.67×25 topics
- Neoliberalism109▲ 4.3×23 topics
- Energy Efficiency92▲ 1.42×35 topics
- Student Engagement69▲ 2.5×15 topics
- Learning Outcomes67▲ 2.3×8 topics
- Feminism63▲ 3.1×19 topics
- Embodiment60▲ 4.6×7 topics
- Emotion60▲ 4.1×12 topics
- Intrinsic Motivation52▲ 6.2×4 topics
- Beamforming50▲ 6.8×4 topics
- Cultural Competence48▲ 5.3×8 topics
- Online Communication48▲ 4.5×3 topics
- Stereotypes46▲ 7.1×3 topics
- Institutional Theory45▲ 6.3×3 topics
- Public Opinion45▲ 5.3×5 topics
- Participatory Design45▲ 12×2 topics
- User Experience42▲ 7.2×3 topics
- Video Games39▲ 10×2 topics
- Esports37▲ 14×1 topic
- Online Gaming37▲ 14×1 topic
Which research topics does Tampere University publish most on?
By volume in 2022-now: Research in Social Sciences, Digital Games and Media, Educational Games and Gamification and Virtual Reality Applications and Impacts.
Area is fractional works; colour is the subfield each topic belongs to.
- 1 Research in Social Sciences Education 379 works
- 2 Digital Games and Media Sociology and Political Science 37 works
- 3 Educational Games and Gamification Developmental and Educational Psychology 31 works
- 4 Virtual Reality Applications and Impacts Human-Computer Interaction 28 works
- 5 Innovative Human-Technology Interaction Human-Computer Interaction 26 works
- 6 Historical Legal Studies and Society Political Science and International Relations 26 works
- 7 Language, Discourse, Communication Strategies Language and Linguistics 25 works
- 8 Social Policy and Reform Studies Political Science and International Relations 25 works
- 9 Ethics and Social Impacts of AI Safety Research 23 works
- 10 Higher Education Governance and Development Political Science and International Relations 23 works
How open and international is its research?
Against the world's own shares: the tick on each track. Both are shares of its output, so they sit on one scale and can be read against each other as well as against the world.
World: 40% of research is openly available.
World: 18% is written across borders.
How has Tampere University's research output changed?
Output in 2022-2025 was 14% higher than in 2018-2021.
The same series as a ribbon: one cell per year, darker for more. The line above answers how much; this answers when.
Its share of all research
Growing output can still be a shrinking share: all of science grows. This is Tampere University as a percentage of every work published that year, 0.029% in 2024.
Fractional works of Tampere University over all fractional works that year. How the balance of science has shifted.
How much of it reaches the world top 10%
Year by year, against all institutions in the same year.
Of each year's output, the share that reached the world's 10% most cited for its field and year. Peak 14.5% in 2022.
Other research institutions in Tampere
- Tampere University of Applied Sciences
- Urho Kaleva Kekkonen Institute
- Pirkanmaa Hospital District
- Fimlab (Finland)
- Coxa Hospital
- Police University College
- Modulight (Finland)
- FIT Biotech (Finland)
Compare Tampere University with
- vs
 University of Colorado Anschutz Medical Campus
- vs Albert Einstein College of Medicine
- vs University of Alabama at Birmingham
- vs
 European Molecular Biology Laboratory
- vs
 University of Wollongong
- vs
 Northumbria University
Share Tampere University's ranking



Research measures only: rankings here say nothing about teaching, admissions or student experience. Comparable institutions and collaboration partners have tabs of their own, above.
Discussion
Ask a question or share a note about Tampere University. Posts are plain text and can be reported.