Boston College
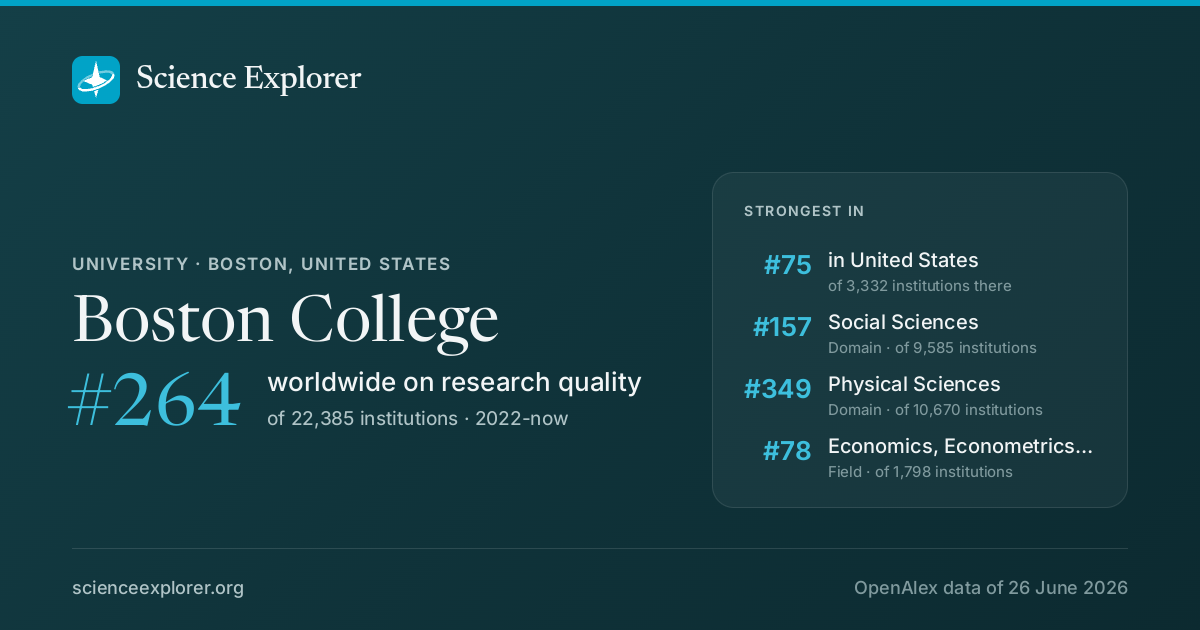
In research, Boston College stands highest in Social Sciences (#157 of 9,585 worldwide), Social Sciences (#117 of 5,988 worldwide) and Physical Sciences (#349 of 10,670 worldwide), 2022-now. Relative to its size it is most specialised in Religious studies, Classics and History (Religious studies is 13.3× its share of world research).
- World rank, 2022-now
- #264 of 22,385 · #237 all time
- Rank in United States
- #75 of 3,332
- Research works
- 27k ▼ 3% vs 2018-21
- Citations
- 798k 29.6 per fractional work
- Top-10% rate
- 12.6% all institutions 10.0%
- vs its own fields
- 1.45× 1.00× is exactly expected
- Open access
- 36% world 40%
- International
- 9% world 18%
What is Boston College known for in research?
The fields where it stands highest, 2022-now, ranked among every institution above the floor in each field.
| Field | World rank | Where that sits | Top-10% rate | Works | All time |
|---|---|---|---|---|---|
| Social SciencesDomain | #157 of 9,585 | 12.2% | 1,963 | #100 | |
| Social SciencesField | #117 of 5,988 | 12.1% | 938 | #84 | |
| Physical SciencesDomain | #349 of 10,670 | 13.6% | 620 | #283 | |
| Economics, Econometrics and FinanceField | #78 of 1,798 | 15.3% | 168 | #76 | |
| Health SciencesDomain | #500 of 9,902 | 13.5% | 357 | #602 | |
| Sociology and Political ScienceSubfield | #149 of 2,526 | 12.8% | 338 | #108 | |
| PsychologyField | #126 of 2,121 | 12.7% | 253 | #85 | |
| MedicineField | #592 of 8,541 | 11.7% | 218 | #746 | |
| Life SciencesDomain | #521 of 6,403 | 11.9% | 226 | #535 | |
| ChemistryField | #107 of 1,299 | 27.9% | 67 | #103 |
Each strip is that field's whole ranked pool, with the notch where Boston College sits in it, in the colour of the band that rank falls in. The track under the rate is the rate itself: it carries no average mark, because the average differs by field (from about 6% in Dentistry to 21% in Economics).
Which of those standings moved
The same fields on both windows: where it stood over the whole record, and where it stands in 2022-now. The distance is the story, and it is the one thing the two rank columns above cannot show.
- Social Sciences#100 #157
- Social Sciences#84 #117
- Physical Sciences#283 #349
- Economics, Econometrics and Finance#76 #78
- Health Sciences#602 #500
- Sociology and Political Science#108 #149
- Psychology#85 #126
- Medicine#746 #592
- Life Sciences#535 #521
- Chemistry#103 #107
A dot further right is a better standing. Fields it was not ranked in over the whole record are left out.
Which fields of science does Boston College work in?
In 2022-now, 61% of research at Boston College is in Social Sciences, 20% in Physical Sciences. Its largest fields are Social Sciences (29%), Arts and Humanities (13%), Psychology (8%). It does 2.5× the world's share of Social Sciences.
Each ring splits the one inside it: the four domains of science, their fields, their subfields. Size is fractional works in 2022-now. Every slice is a page; the interactive view zooms down to single topics and colours each by how much more of it this institution does than the world.
Its 4 domains and 26 fields, with their numbers
- Social Sciences2,14961.2%
- Social Sciences1,02029.0%
- Arts and Humanities44712.7%
- Psychology2918.3%
- Economics, Econometrics and Finance1755.0%
- Business, Management and Accounting1464.2%
- Decision Sciences702.0%
- Physical Sciences70420.1%
- Computer Science1484.2%
- Engineering942.7%
- Environmental Science882.5%
- Mathematics842.4%
- Physics and Astronomy822.3%
- Chemistry762.2%
- Earth and Planetary Sciences561.6%
- Materials Science451.3%
- Energy250.7%
- Chemical Engineering70.2%
- Health Sciences39911.4%
- Medicine2487.1%
- Health Professions1303.7%
- Nursing190.5%
- Veterinary10.0%
- Dentistry00.0%
- Life Sciences2597.4%
What does Boston College specialise in?
Where its research is concentrated relative to its size: Religious studies takes 13.3× the share of its output that it takes of world research.
- Religious studiesSubfield · 78.0 works13×
- ClassicsSubfield · 26.9 works13×
- HistorySubfield · 80.6 works7.1×
- History and Philosophy of ScienceSubfield · 36.4 works6.7×
- PhilosophySubfield · 94.5 works6.3×
Location quotient, a volume reading rather than an impact one. It surfaces small, lopsided specialities.
Field profile
Location quotient across every field it publishes in: outside the ring is more than an institution of this size would be expected to publish, inside it is less.
Rings at 0.5×, 1× and 2×. Widest outward: Arts and Humanities, 4.4×. Every wedge is a field page.
All 26 fields, with their numbers
- Arts and Humanities4.41×447 works
- Psychology2.72×291 works
- Economics, Econometrics and Finance2.34×176 works
- Social Sciences2.30×1,020 works
- Decision Sciences2.05×70 works
- Mathematics2.02×84 works
- Neuroscience1.77×101 works
- Health Professions1.41×130 works
- Chemistry1.37×76 works
- Business, Management and Accounting1.29×146 works
- Nursing1.10×19 works
- Physics and Astronomy1.06×82 works
- Earth and Planetary Sciences1.01×56 works
- Energy0.78×25 works
- Biochemistry, Genetics and Molecular Biology0.58×108 works
- Chemical Engineering0.58×7 works
- Computer Science0.54×148 works
- Environmental Science0.51×88 works
- Materials Science0.37×45 works
- Medicine0.37×248 works
- Pharmacology, Toxicology and Pharmaceutics0.32×4 works
- Agricultural and Biological Sciences0.24×40 works
- Immunology and Microbiology0.18×6 works
- Engineering0.18×94 works
- Veterinary0.18×1 works
- Dentistry0.03×0 works
- Arts and Humanities 4.4×
- Psychology 2.7×
- Economics, Econometrics and Finance 2.3×
- Social Sciences 2.3×
- Decision Sciences 2.0×
- Mathematics 2.0×
- Neuroscience 1.8×
- Health Professions 1.4×
- Chemistry 1.4×
- Business, Management and Accounting 1.3×
- Nursing 1.1×
- Physics and Astronomy 1.1×
- Earth and Planetary Sciences 1.0×
- Energy 0.8×
- Biochemistry, Genetics and Molecular Biology 0.6×
- Chemical Engineering 0.6×
- Computer Science 0.5×
- Environmental Science 0.5×
- Materials Science 0.4×
- Medicine 0.4×
- Pharmacology, Toxicology and Pharmaceutics 0.3×
- Agricultural and Biological Sciences 0.2×
- Immunology and Microbiology 0.2×
- Engineering 0.2×
- Veterinary 0.2×
- Dentistry 0.0×
Who are the top researchers at Boston College?
Ranked on the quality score, Philip E. Strahan, Seung‐A Annie Jin and Amir H. Hoveyda lead among researchers whose main affiliation is Boston College.
- 1
Philip E. Strahan
 United States · #9,011 worldwide
25k citations · 218 works
- 2
Seung‐A Annie Jin
United States · #15,527 worldwide
8.6k citations · 104 works
- 3
Amir H. Hoveyda
United States · #15,763 worldwide
42k citations · 867 works
- 4
Chia‐Kuang Tsung
United States · #22,028 worldwide
17k citations · 126 works
- 5
Andy Hargreaves
United States · #22,630 worldwide
28k citations · 281 works
- 6
David L. Blustein
United States · #22,810 worldwide
16k citations · 264 works
- 7
Marilyn Cochran‐Smith
United States · #23,152 worldwide
26k citations · 257 works
- 8
Michael G. Pratt
United States · #24,890 worldwide
22k citations · 183 works
- 9
Eric Dearing
United States · #25,902 worldwide
6.3k citations · 109 works
- 10
Thomas J. Chemmanur
United States · #26,129 worldwide
11k citations · 225 works
Which keywords describe research at Boston College?
By fractional works in 2022-now, weighted toward what it does more of than the world: Religion, Ethics, Mental Health, Globalization, History, Identity, Nationalism and Social Justice.
- Jewish Society
- Constitutional government
- Acculturation
- Political Philosophy
- Emotion
- Psychology
- Health Disparities
- Democracy
- Cultural Identity
- Higher Education
- Feminism
- Theology
- Colonialism
- Literature
- Human Rights
- Philosophy
- Social Justice
- History
- Ethics
- Mental Health
- Globalization
- Religion
- Education
- Identity
- Nationalism
- Gender
- Public Health
- Culture
- Economic Growth
- Social Support
- Neoliberalism
- Secularism
- Society
- Diversity
- Public Opinion
- Intersectionality
- Federalism
- Academic Achievement
- American founding
- Biblical Monotheism
Size is fractional works in 2022-now in the topics tagged with each word; colour is the word's share of this institution's work against its share of the world's. The 40 words are chosen for being large and distinctive. Each links to the topic it comes from most.
All 40 words, with their numbers
- Globalization174▲ 2.5×97 topics
- Mental Health156▲ 3.1×39 topics
- Religion136▲ 8.4×37 topics
- Ethics121▲ 6.8×41 topics
- Education118▲ 1.96×78 topics
- History117▲ 4.8×40 topics
- Identity112▲ 4.4×50 topics
- Social Justice97▲ 4.6×34 topics
- Nationalism89▲ 5.7×27 topics
- Philosophy87▲ 5.6×33 topics
- Gender82▲ 4.3×48 topics
- Human Rights79▲ 2.2×59 topics
- Public Health78▲ 1.53×44 topics
- Literature77▲ 4.0×45 topics
- Culture66▲ 3.6×25 topics
- Colonialism65▲ 3.9×36 topics
- Economic Growth64▲ 2.2×22 topics
- Theology62▲ 19×6 topics
- Social Support61▲ 3.2×16 topics
- Feminism55▲ 5.4×19 topics
- Neoliberalism54▲ 4.3×23 topics
- Higher Education52▲ 2.8×20 topics
- Secularism49▲ 14×5 topics
- Cultural Identity49▲ 2.8×26 topics
- Society49▲ 7.3×17 topics
- Democracy48▲ 3.9×25 topics
- Diversity48▲ 7.7×9 topics
- Health Disparities47▲ 5.1×8 topics
- Public Opinion39▲ 9.2×6 topics
- Psychology39▲ 8.3×13 topics
- Intersectionality37▲ 5.5×13 topics
- Emotion36▲ 5.0×11 topics
- Federalism35▲ 16×3 topics
- Political Philosophy35▲ 18×4 topics
- Academic Achievement34▲ 5.7×10 topics
- Acculturation33▲ 13×2 topics
- American founding32▲ 32×1 topic
- Constitutional government32▲ 32×1 topic
- Biblical Monotheism30▲ 34×1 topic
- Jewish Society30▲ 34×1 topic
Which research topics does Boston College publish most on?
By volume in 2022-now: American Constitutional Law and Politics, Biblical Studies and Interpretation, Religious Education and Schools and Higher Education Governance and Development.
Area is fractional works; colour is the subfield each topic belongs to.
- 1 American Constitutional Law and Politics Political Science and International Relations 32 works
- 2 Biblical Studies and Interpretation Religious studies 30 works
- 3 Religious Education and Schools Education 20 works
- 4 Higher Education Governance and Development Political Science and International Relations 19 works
- 5 Catholicism and Religious Studies History 18 works
- 6 Medieval Literature and History Classics 18 works
- 7 Reformation and Early Modern Christianity History 17 works
- 8 Racial and Ethnic Identity Research Sociology and Political Science 17 works
- 9 Migration, Health and Trauma Clinical Psychology 16 works
- 10 Employment and Welfare Studies General Health Professions 16 works
How open and international is its research?
Against the world's own shares: the tick on each track. Both are shares of its output, so they sit on one scale and can be read against each other as well as against the world.
World: 40% of research is openly available.
World: 18% is written across borders.
How has Boston College's research output changed?
Output in 2022-2025 was 3% lower than in 2018-2021.
The same series as a ribbon: one cell per year, darker for more. The line above answers how much; this answers when.
Its share of all research
Growing output can still be a shrinking share: all of science grows. This is Boston College as a percentage of every work published that year, 0.014% in 2024.
Fractional works of Boston College over all fractional works that year. How the balance of science has shifted.
How much of it reaches the world top 10%
Year by year, against all institutions in the same year.
Of each year's output, the share that reached the world's 10% most cited for its field and year. Peak 18.1% in 2003.
Other research institutions in Boston
- Boston University
- Northeastern University
- General Electric (United States)
- University of Massachusetts Boston
- Boston Medical Center
- Suffolk University
- State Street (United States)
- Boston Children's Museum



Which institutions have research most like Boston College's?
Among the world's leading institutions, University of York has the research profile closest to Boston College's, with both strong in Arts and Humanities.
- 1
University of York
 United Kingdom · Both strong in Arts and Humanities, Psychology, Economics, Econometrics and Finance
0.87 Compare
- 2
City University of New YorkUnited States · Both strong in Psychology, Arts and Humanities, Mathematics
0.86 Compare
- 3
Florida State UniversityUnited States · Both strong in Psychology, Neuroscience, Arts and Humanities
0.85 Compare
- 4
Stockholm University
 Sweden · Both strong in Arts and Humanities, Psychology, Social Sciences
0.83 Compare
- 5
Durham UniversityUnited Kingdom · Both strong in Arts and Humanities, Mathematics, Social Sciences
0.81 Compare

Similarity is the correlation of each side's location quotients across every field it publishes in, on a log scale: 1 is the same shape of research, 0 is unrelated. It ignores size. How it is measured.
Compare Boston College with
- vs
 Wageningen University & Research
- vs Florida State University
- vs
 Nanjing Normal University
- vs Tufts University
- vs
 Universidad Autónoma de Madrid
- vs
 University of Duisburg-Essen
Share Boston College's ranking



Research measures only: rankings here say nothing about teaching, admissions or student experience. Comparable institutions and collaboration partners have tabs of their own, above.
Discussion
Ask a question or share a note about Boston College. Posts are plain text and can be reported.