Science Explorer Back to mapMap
Discussion
University · Kathmandu · Nepal

Kathmandu University

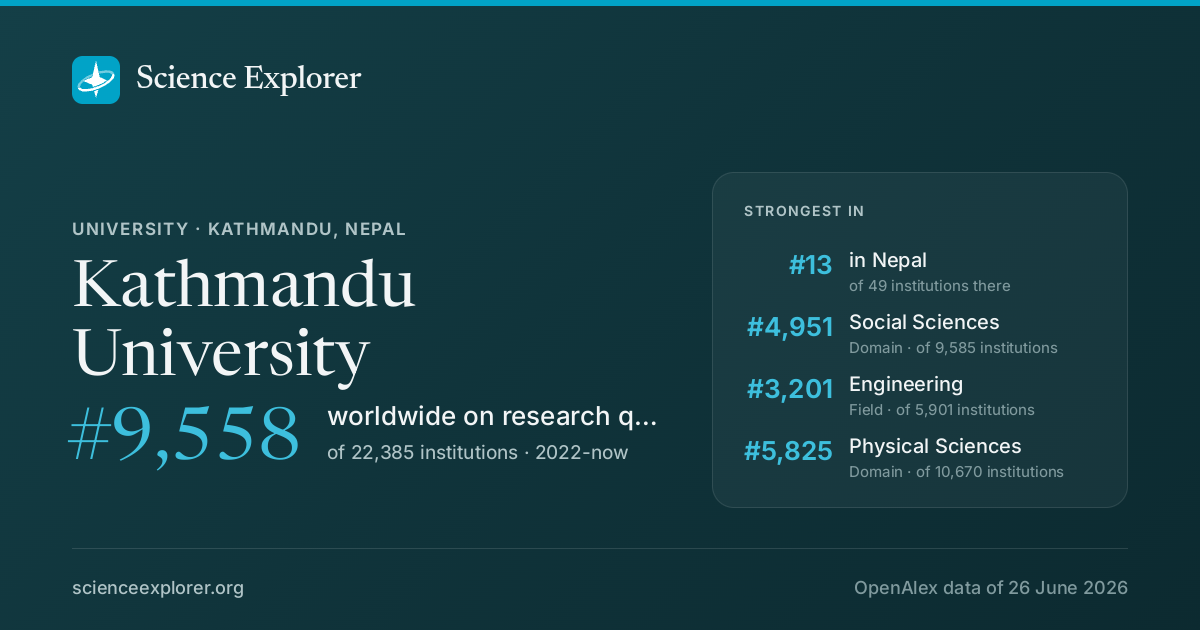
In research, Kathmandu University stands highest in Social Sciences (#4,951 of 9,585 worldwide), Engineering (#3,201 of 5,901 worldwide) and Physical Sciences (#5,825 of 10,670 worldwide), 2022-now. Relative to its size it is most specialised in Periodontics, Oral Surgery and Dentistry (Periodontics is 5.4× its share of world research).

World rank, 2022-now
#9,558
of 22,385 · #16,263 all time
Rank in Nepal
#13
of 49
Research works
10k
▲ 33% vs 2018-21
Citations
64k
6.1 per fractional work
Top-10% rate
4.5%
all institutions 10.0%
vs its own fields
0.35×
1.00× is exactly expected
Open access
83%
world 40%
International
17%
world 18%

What is Kathmandu University known for in research?

The fields where it stands highest, 2022-now, ranked among every institution above the floor in each field.

FieldWorld rankWhere that sitsTop-10% rateWorksAll time
Social SciencesDomain #4,951 of 9,585 6.1%1,065 #7896
EngineeringField #3,201 of 5,901 5.4%338 #6321
Physical SciencesDomain #5,825 of 10,670 6.0%789 #7256
EducationSubfield #1,420 of 1,930 9.7%201 #2378
Social SciencesField #4,536 of 5,988 7.5%485 #7437
Environmental ScienceField #2,688 of 3,334 5.3%161 #4337
Business, Management and AccountingField #2,131 of 2,581 4.8%171 #3454
DentistryField #346 of 405 2.0%95 #725
Arts and HumanitiesField #1,669 of 1,896 7.9%79 #2681
Electrical and Electronic EngineeringSubfield #1,928 of 2,176 6.3%64 #3428

Each strip is that field's whole ranked pool, with the notch where Kathmandu University sits in it, in the colour of the band that rank falls in. The track under the rate is the rate itself: it carries no average mark, because the average differs by field (from about 6% in Dentistry to 21% in Economics).

Which of those standings moved

The same fields on both windows: where it stood over the whole record, and where it stands in 2022-now. The distance is the story, and it is the one thing the two rank columns above cannot show.

  1. Social Sciences#7,896 #4,951
  2. Engineering#6,321 #3,201
  3. Physical Sciences#7,256 #5,825
  4. Education#2,378 #1,420
  5. Social Sciences#7,437 #4,536
  6. Environmental Science#4,337 #2,688
  7. Business, Management and Accounting#3,454 #2,131
  8. Dentistry#725 #346
  9. Arts and Humanities#2,681 #1,669
  10. Electrical and Electronic Engineering#3,428 #1,928
all time2022-now, better2022-now, worse

A dot further right is a better standing. Fields it was not ranked in over the whole record are left out.

Which fields of science does Kathmandu University work in?

In 2022-now, 45% of research at Kathmandu University is in Health Sciences, 27% in Social Sciences. Its largest fields are Medicine (38%), Social Sciences (12%), Engineering (8%). It does 2.0× the world's share of Health Sciences.

Health Sciences: 2,006 fractional works · 45.2% of its workMedicine: 1,691 fractional works · 38.1% of its workSurgery: 309 fractional works · 7.0% of its workPulmonary and Respiratory Medicine: 139 fractional works · 3.1% of its workEpidemiology: 130 fractional works · 2.9% of its workPublic Health, Environmental and Occupational Health: 119 fractional works · 2.7% of its workPediatrics, Perinatology and Child Health: 87 fractional works · 2.0% of its workInfectious Diseases: 64 fractional works · 1.4% of its workEndocrinology, Diabetes and Metabolism: 62 fractional works · 1.4% of its workCardiology and Cardiovascular Medicine: 61 fractional works · 1.4% of its workRheumatology: 51 fractional works · 1.1% of its workRadiology, Nuclear Medicine and Imaging: 50 fractional works · 1.1% of its workObstetrics and Gynecology: 50 fractional works · 1.1% of its workEmergency Medicine: 48 fractional works · 1.1% of its workOncology: 47 fractional works · 1.1% of its workNeurology: 45 fractional works · 1.0% of its workPhysiology: 44 fractional works · 1.0% of its workPathology and Forensic Medicine: 42 fractional works · 1.0% of its workDermatology: 28 fractional works · 0.6% of its workHematology: 27 fractional works · 0.6% of its workOphthalmology: 25 fractional works · 0.6% of its workPsychiatry and Mental health: 25 fractional works · 0.6% of its workPharmacology: 22 fractional works · 0.5% of its workNephrology: 20 fractional works · 0.4% of its workAnesthesiology and Pain Medicine: 18 fractional works · 0.4% of its workOtorhinolaryngology: 17 fractional works · 0.4% of its workUrology: 17 fractional works · 0.4% of its workCritical Care and Intensive Care Medicine: 16 fractional works · 0.4% of its workReproductive Medicine: 15 fractional works · 0.3% of its workGenetics: 14 fractional works · 0.3% of its workHepatology: 13 fractional works · 0.3% of its workRehabilitation: 12 fractional works · 0.3% of its workOrthopedics and Sports Medicine: 11 fractional works · 0.3% of its workHealth Informatics: 10 fractional works · 0.2% of its workComplementary and alternative medicine: 10 fractional works · 0.2% of its workGastroenterology: 10 fractional works · 0.2% of its workSmaller subfields together: 32 fractional works · 0.7% of its workHealth Professions: 178 fractional works · 4.0% of its workGeneral Health Professions: 83 fractional works · 1.9% of its workHealth Information Management: 23 fractional works · 0.5% of its workEmergency Medical Services: 21 fractional works · 0.5% of its workSpeech and Hearing: 14 fractional works · 0.3% of its workPharmacy: 11 fractional works · 0.3% of its workSmaller subfields together: 26 fractional works · 0.6% of its workDentistry: 101 fractional works · 2.3% of its workOral Surgery: 41 fractional works · 0.9% of its workPeriodontics: 33 fractional works · 0.7% of its workGeneral Dentistry: 16 fractional works · 0.4% of its workOrthodontics: 12 fractional works · 0.3% of its workNursing: 32 fractional works · 0.7% of its workNutrition and Dietetics: 26 fractional works · 0.6% of its workSmaller subfields together: 6 fractional works · 0.1% of its workVeterinary: 4 fractional works · 0.1% of its workSocial Sciences: 1,194 fractional works · 26.9% of its workSocial Sciences: 554 fractional works · 12.5% of its workEducation: 216 fractional works · 4.9% of its workSociology and Political Science: 117 fractional works · 2.6% of its workDemography: 48 fractional works · 1.1% of its workPolitical Science and International Relations: 47 fractional works · 1.1% of its workGender Studies: 22 fractional works · 0.5% of its workHealth: 19 fractional works · 0.4% of its workSafety Research: 18 fractional works · 0.4% of its workTransportation: 10 fractional works · 0.2% of its workHuman Factors and Ergonomics: 9 fractional works · 0.2% of its workSmaller subfields together: 48 fractional works · 1.1% of its workBusiness, Management and Accounting: 187 fractional works · 4.2% of its workAccounting: 46 fractional works · 1.0% of its workOrganizational Behavior and Human Resource Management: 41 fractional works · 0.9% of its workStrategy and Management: 32 fractional works · 0.7% of its workManagement of Technology and Innovation: 21 fractional works · 0.5% of its workMarketing: 20 fractional works · 0.5% of its workManagement Information Systems: 13 fractional works · 0.3% of its workBusiness and International Management: 13 fractional works · 0.3% of its workPsychology: 170 fractional works · 3.8% of its workClinical Psychology: 76 fractional works · 1.7% of its workSocial Psychology: 49 fractional works · 1.1% of its workDevelopmental and Educational Psychology: 21 fractional works · 0.5% of its workExperimental and Cognitive Psychology: 15 fractional works · 0.3% of its workSmaller subfields together: 9 fractional works · 0.2% of its workEconomics, Econometrics and Finance: 135 fractional works · 3.0% of its workEconomics and Econometrics: 98 fractional works · 2.2% of its workFinance: 27 fractional works · 0.6% of its workGeneral Economics, Econometrics and Finance: 9 fractional works · 0.2% of its workArts and Humanities: 89 fractional works · 2.0% of its workLiterature and Literary Theory: 29 fractional works · 0.7% of its workLanguage and Linguistics: 21 fractional works · 0.5% of its workPhilosophy: 16 fractional works · 0.4% of its workArcheology: 9 fractional works · 0.2% of its workSmaller subfields together: 15 fractional works · 0.3% of its workDecision Sciences: 59 fractional works · 1.3% of its workManagement Science and Operations Research: 33 fractional works · 0.7% of its workInformation Systems and Management: 19 fractional works · 0.4% of its workSmaller subfields together: 7 fractional works · 0.2% of its workPhysical Sciences: 895 fractional works · 20.2% of its workEngineering: 373 fractional works · 8.4% of its workElectrical and Electronic Engineering: 71 fractional works · 1.6% of its workCivil and Structural Engineering: 47 fractional works · 1.1% of its workBiomedical Engineering: 39 fractional works · 0.9% of its workBuilding and Construction: 33 fractional works · 0.7% of its workMechanical Engineering: 32 fractional works · 0.7% of its workControl and Systems Engineering: 26 fractional works · 0.6% of its workMechanics of Materials: 22 fractional works · 0.5% of its workAerospace Engineering: 19 fractional works · 0.4% of its workMedia Technology: 18 fractional works · 0.4% of its workAutomotive Engineering: 17 fractional works · 0.4% of its workOcean Engineering: 15 fractional works · 0.3% of its workComputational Mechanics: 12 fractional works · 0.3% of its workSafety, Risk, Reliability and Quality: 11 fractional works · 0.3% of its workSmaller subfields together: 10 fractional works · 0.2% of its workComputer Science: 205 fractional works · 4.6% of its workInformation Systems: 64 fractional works · 1.4% of its workArtificial Intelligence: 60 fractional works · 1.4% of its workComputer Vision and Pattern Recognition: 30 fractional works · 0.7% of its workComputer Networks and Communications: 18 fractional works · 0.4% of its workSmaller subfields together: 32 fractional works · 0.7% of its workEnvironmental Science: 184 fractional works · 4.1% of its workGlobal and Planetary Change: 35 fractional works · 0.8% of its workManagement, Monitoring, Policy and Law: 23 fractional works · 0.5% of its workWater Science and Technology: 21 fractional works · 0.5% of its workPollution: 21 fractional works · 0.5% of its workEcology: 19 fractional works · 0.4% of its workEnvironmental Engineering: 19 fractional works · 0.4% of its workIndustrial and Manufacturing Engineering: 16 fractional works · 0.4% of its workEcological Modeling: 11 fractional works · 0.3% of its workHealth, Toxicology and Mutagenesis: 9 fractional works · 0.2% of its workSmaller subfields together: 8 fractional works · 0.2% of its workMathematics: 30 fractional works · 0.7% of its workModeling and Simulation: 11 fractional works · 0.3% of its workSmaller subfields together: 19 fractional works · 0.4% of its workMaterials Science: 27 fractional works · 0.6% of its workMaterials Chemistry: 15 fractional works · 0.3% of its workSmaller subfields together: 12 fractional works · 0.3% of its workEarth and Planetary Sciences: 25 fractional works · 0.6% of its workAtmospheric Science: 14 fractional works · 0.3% of its workSmaller subfields together: 10 fractional works · 0.2% of its workEnergy: 25 fractional works · 0.6% of its workRenewable Energy, Sustainability and the Environment: 13 fractional works · 0.3% of its workEnergy Engineering and Power Technology: 11 fractional works · 0.3% of its workPhysics and Astronomy: 15 fractional works · 0.3% of its workChemistry: 9 fractional works · 0.2% of its workChemical Engineering: 3 fractional works · 0.1% of its workLife Sciences: 342 fractional works · 7.7% of its workBiochemistry, Genetics and Molecular Biology: 129 fractional works · 2.9% of its workMolecular Biology: 49 fractional works · 1.1% of its workGenetics: 40 fractional works · 0.9% of its workSmaller subfields together: 40 fractional works · 0.9% of its workAgricultural and Biological Sciences: 114 fractional works · 2.6% of its workPlant Science: 51 fractional works · 1.2% of its workFood Science: 19 fractional works · 0.4% of its workGeneral Agricultural and Biological Sciences: 14 fractional works · 0.3% of its workSoil Science: 10 fractional works · 0.2% of its workSmaller subfields together: 20 fractional works · 0.5% of its workImmunology and Microbiology: 50 fractional works · 1.1% of its workImmunology: 19 fractional works · 0.4% of its workApplied Microbiology and Biotechnology: 13 fractional works · 0.3% of its workSmaller subfields together: 18 fractional works · 0.4% of its workNeuroscience: 30 fractional works · 0.7% of its workCognitive Neuroscience: 11 fractional works · 0.3% of its workSmaller subfields together: 19 fractional works · 0.4% of its workPharmacology, Toxicology and Pharmaceutics: 18 fractional works · 0.4% of its workPharmacology: 9 fractional works · 0.2% of its workSmaller subfields together: 9 fractional works · 0.2% of its workALL ITS WORKKathmanduUniversity4,437fractional works, 2022-now
Life Sciences8%Physical Sciences20%Health Sciences45%Social Sciences27%

Each ring splits the one inside it: the four domains of science, their fields, their subfields. Size is fractional works in 2022-now. Every slice is a page; the interactive view zooms down to single topics and colours each by how much more of it this institution does than the world.

Its 4 domains and 26 fields, with their numbers
  1. Health Sciences2,00645.2%
    1. Medicine1,69138.1%
    2. Health Professions1784.0%
    3. Dentistry1012.3%
    4. Nursing320.7%
    5. Veterinary40.1%
  2. Social Sciences1,19426.9%
    1. Social Sciences55412.5%
    2. Business, Management and Accounting1874.2%
    3. Psychology1703.8%
    4. Economics, Econometrics and Finance1353.0%
    5. Arts and Humanities892.0%
    6. Decision Sciences591.3%
    1. Engineering3738.4%
    2. Computer Science2054.6%
    3. Environmental Science1844.1%
    4. Mathematics300.7%
    5. Materials Science270.6%
    6. Earth and Planetary Sciences250.6%
    7. Energy250.6%
    8. Physics and Astronomy150.3%
    9. Chemistry90.2%
    10. Chemical Engineering30.1%
    1. Biochemistry, Genetics and Molecular Biology1292.9%
    2. Agricultural and Biological Sciences1142.6%
    3. Immunology and Microbiology501.1%
    4. Neuroscience300.7%
    5. Pharmacology, Toxicology and Pharmaceutics180.4%
All of science, and how each field's share has moved since 1950: the Science domain explorer

What does Kathmandu University specialise in?

Where its research is concentrated relative to its size: Periodontics takes 5.4× the share of its output that it takes of world research.

  1. PeriodonticsSubfield · 32.8 works5.4×
  2. Oral SurgerySubfield · 40.9 works4.8×
  3. DentistryField · 100.9 works4.7×
  4. Emergency MedicineSubfield · 47.6 works4.4×
← less than its size predicts1×more →

Location quotient, a volume reading rather than an impact one. It surfaces small, lopsided specialities.

Field profile

Location quotient across every field it publishes in: outside the ring is more than an institution of this size would be expected to publish, inside it is less.

Agricultural and Biological Sciences: 0.54× its world share, 114 worksAgricultural and Bio…Biochemistry, Genetics and Molecular Biology: 0.55× its world share, 129 worksBiochemistry, Geneti…Immunology and Microbiology: 1.12× its world share, 50 worksImmunology and Micro…Neuroscience: 0.42× its world share, 30 worksNeurosciencePharmacology, Toxicology and Pharmaceutics: 1.17× its world share, 18 worksPharmacology, Toxico…Chemical Engineering: 0.21× its world share, 3 worksChemical EngineeringChemistry: 0.13× its world share, 9 worksChemistryComputer Science: 0.59× its world share, 205 worksComputer ScienceEarth and Planetary Sciences: 0.35× its world share, 25 worksEarth and Planetary …Energy: 0.60× its world share, 25 worksEnergyEngineering: 0.56× its world share, 373 worksEngineeringEnvironmental Science: 0.83× its world share, 184 worksEnvironmental ScienceMaterials Science: 0.17× its world share, 27 worksMaterials ScienceMathematics: 0.58× its world share, 30 worksMathematicsPhysics and Astronomy: 0.16× its world share, 15 worksPhysics and AstronomyDentistry: 4.69× its world share, 101 worksDentistryHealth Professions: 1.52× its world share, 178 worksHealth ProfessionsMedicine: 1.98× its world share, 1,691 worksMedicineNursing: 1.48× its world share, 32 worksNursingVeterinary: 0.71× its world share, 4 worksVeterinaryArts and Humanities: 0.70× its world share, 89 worksArts and HumanitiesBusiness, Management and Accounting: 1.31× its world share, 187 worksBusiness, Management…Decision Sciences: 1.37× its world share, 59 worksDecision SciencesEconomics, Econometrics and Finance: 1.42× its world share, 135 worksEconomics, Econometr…Psychology: 1.26× its world share, 170 worksPsychologySocial Sciences: 0.99× its world share, 554 worksSocial Sciences1×world share
more than its size predictsabout as predictedless

Rings at 0.5×, 1× and 2×. Widest outward: Dentistry, 4.7×. Every wedge is a field page.

All 26 fields, with their numbers
  1. Dentistry4.69×101 works
  2. Medicine1.98×1,691 works
  3. Health Professions1.52×178 works
  4. Nursing1.48×32 works
  5. Economics, Econometrics and Finance1.42×135 works
  6. Decision Sciences1.37×59 works
  7. Business, Management and Accounting1.31×187 works
  8. Psychology1.26×170 works
  9. Pharmacology, Toxicology and Pharmaceutics1.17×18 works
  10. Immunology and Microbiology1.12×50 works
  11. Social Sciences0.99×554 works
  12. Environmental Science0.83×184 works
  13. Veterinary0.71×4 works
  14. Arts and Humanities0.70×89 works
  15. Energy0.60×25 works
  16. Computer Science0.59×205 works
  17. Mathematics0.58×30 works
  18. Engineering0.56×373 works
  19. Biochemistry, Genetics and Molecular Biology0.55×129 works
  20. Agricultural and Biological Sciences0.54×114 works
  21. Neuroscience0.42×30 works
  22. Earth and Planetary Sciences0.35×25 works
  23. Chemical Engineering0.21×3 works
  24. Materials Science0.17×27 works
  25. Physics and Astronomy0.16×15 works
  26. Chemistry0.13×9 works

Who are the top researchers at Kathmandu University?

Ranked on the quality score, Niroj Dahal, Anish Ghimire and Binod Prasad Pant lead among researchers whose main affiliation is Kathmandu University.

  1. 1 Niroj Dahal Nepal · #821,696 worldwide 800 citations · 103 works
  2. 2 Anish Ghimire Nepal · #854,537 worldwide 3.7k citations · 84 works
  3. 3 Binod Prasad Pant Nepal · #1,358,984 worldwide 513 citations · 56 works
  4. 4 Bal Chandra Luitel Nepal · #1,393,220 worldwide 1.1k citations · 103 works
  5. 5 Biraj Man Karmacharya Nepal · #1,540,438 worldwide 1.4k citations · 98 works
  6. 6 Dipesh Tamrakar Nepal · #1,622,836 worldwide 1.1k citations · 89 works
  7. 7 Sunil Prasad Lohani Nepal · #1,711,444 worldwide 1.3k citations · 87 works
  8. 8 Rijan Bhakta Kayastha Nepal · #1,769,691 worldwide 2.7k citations · 163 works
  9. 9 Archana Shrestha Nepal · #1,842,286 worldwide 3.8k citations · 251 works
  10. 10 Subodh Sharma Nepal · #1,935,239 worldwide 579 citations · 19 works
All ranked researchers at Kathmandu University

What are the most cited papers from Kathmandu University?

The most cited paper from Kathmandu University is "Intensive care management of coronavirus disease 2019 (COVID-19): challenges and recommendations" (Jason Phua, Li Weng, Lowell Ling et al., 2020), with 1,580 citations. Next come "A living WHO guideline on drugs for covid-19 (2020-2023)" (1,096) and "Technological trends in heavy metals removal from industrial wastewater: A review" (963).

Most cited papers
#PaperReleasedCitations
1 Intensive care management of coronavirus disease 2019 (COVID-19): challenges and recommendations Jason Phua, Li Weng, Lowell Ling et al. · The Lancet Respiratory Medicine Open access 6 Apr 2020 1,580
2 A living WHO guideline on drugs for covid-19 (2020-2023) Arnav Agarwal et al. · BMJ Open access 4 Sep 2020 1,096
3 Technological trends in heavy metals removal from industrial wastewater: A review Rakesh Shrestha, Sagar Ban, Sijan Devkota et al. · Journal of environmental chemical engineering 17 May 2021 963
4 Effect of a participatory intervention with women's groups on birth outcomes in Nepal: cluster-randomised controlled trial Dharma Sharna Manandhar, David Osrin, Bhim Prasad Shrestha et al. · The Lancet Sep 2004 861
5 Burden of 375 diseases and injuries, risk-attributable burden of 88 risk factors, and healthy life expectancy in 204 countries and territories, including 660 subnational locations, 1990–2023: a systematic analysis for the Global Burden of Disease Study 2023 Simon I Hay et al. · The Lancet Open access2,780 authors Oct 2025 762
All 60 most cited papers, with filters and sorting

Which keywords describe research at Kathmandu University?

By fractional works in 2022-now, weighted toward what it does more of than the world: Epidemiology, Diagnosis, Treatment, Quality of Life, Risk Factors, Management, COVID-19 and Maternal Mortality.

▲ more of its work than of the world's◆ about the world's share▼ less than the world's

Size is fractional works in 2022-now in the topics tagged with each word; colour is the word's share of this institution's work against its share of the world's. The 40 words are chosen for being large and distinctive. Each links to the topic it comes from most.

All 40 words, with their numbers
  1. Epidemiology403▲ 2.3×127 topics
  2. Machine Learning133◆ 0.90×80 topics
  3. Quality of Life130▲ 2.0×51 topics
  4. Treatment125▲ 2.3×49 topics
  5. Climate Change122◆ 1.01×79 topics
  6. Inflammation121▲ 1.28×70 topics
  7. Sustainability119◆ 1.10×72 topics
  8. COVID-19119▲ 2.1×26 topics
  9. Globalization118▲ 1.35×60 topics
  10. Diagnosis117▲ 2.8×39 topics
  11. Risk Factors116▲ 2.4×34 topics
  12. Deep Learning114▼ 0.74×67 topics
  13. Education106▲ 1.39×60 topics
  14. Public Health105▲ 1.62×53 topics
  15. Management100▲ 2.8×36 topics
  16. Mental Health89▲ 1.40×37 topics
  17. Renewable Energy88▲ 1.37×39 topics
  18. Cardiovascular Disease84▲ 1.66×35 topics
  19. Pandemic80▲ 1.82×12 topics
  20. Depression76▲ 1.94×21 topics
  21. Educational Technology74▲ 1.40×33 topics
  22. Meta-Analysis70▲ 2.7×19 topics
  23. Global Burden69▲ 2.9×12 topics
  24. Complications69▲ 3.1×17 topics
  25. Surgical Management67▲ 3.7×20 topics
  26. Metabolic Syndrome66▲ 1.85×24 topics
  27. Economic Growth65▲ 1.79×25 topics
  28. Maternal Mortality56▲ 5.7×5 topics
  29. Higher Education56▲ 2.4×19 topics
  30. Mortality54▲ 2.1×13 topics
  31. Guidelines52▲ 2.5×12 topics
  32. Technology Integration51▲ 3.7×10 topics
  33. Reflective Practice44▲ 5.3×7 topics
  34. Conflict40▲ 5.6×8 topics
  35. Lifelong Learning38▲ 4.2×9 topics
  36. Student Perceptions37▲ 4.7×7 topics
  37. Poverty34▲ 8.2×4 topics
  38. Health Inequalities33▲ 6.0×5 topics
  39. Community Health Workers32▲ 8.0×2 topics
  40. Child Mortality28▲ 8.7×1 topic

Which research topics does Kathmandu University publish most on?

By volume in 2022-now: Global Maternal and Child Health, Sociopolitical Dynamics in Nepal, Education and Critical Thinking Development and COVID-19 Pandemic Impacts.

  1. 1 Global Maternal and Child Health Pediatrics, Perinatology and Child Health 28 works
  2. 2 Sociopolitical Dynamics in Nepal Demography 26 works
  3. 3 Education and Critical Thinking Development Education 21 works
  4. 4 COVID-19 Pandemic Impacts Economics and Econometrics 21 works
  5. 5 Health and Well-being Studies Clinical Psychology 19 works
  6. 6 Technology-Enhanced Education Studies Education 18 works
  7. 7 Child Nutrition and Water Access Nutrition and Dietetics 17 works
  8. 8 Second Language Learning and Teaching Literature and Literary Theory 17 works
  9. 9 COVID-19 and Mental Health Clinical Psychology 17 works
  10. 10 Dental Research and COVID-19 General Dentistry 16 works

How open and international is its research?

Against the world's own shares: the tick on each track. Both are shares of its output, so they sit on one scale and can be read against each other as well as against the world.

openly available82.9%not open17.1%

World: 40% of research is openly available.

with international co-authors17.2%domestic only82.8%

World: 18% is written across borders.

How has Kathmandu University's research output changed?

Output in 2022-2025 was 33% higher than in 2018-2021.

still counting1990200020102020
grewheldshrank

The same series as a ribbon: one cell per year, darker for more. The line above answers how much; this answers when.

Its share of all research

Growing output can still be a shrinking share: all of science grows. This is Kathmandu University as a percentage of every work published that year, 0.019% in 2024.

still counting0.050%0.10%Kathmandu University0.019% in 202519801990200020102020

Fractional works of Kathmandu University over all fractional works that year. How the balance of science has shifted.

How much of it reaches the world top 10%

Year by year, against all institutions in the same year.

still counting5%10%15%all institutions10.0% in 2025Kathmandu University4.5% in 202520102020

Of each year's output, the share that reached the world's 10% most cited for its field and year. Peak 5.0% in 2015.

Other research institutions in Kathmandu

All research institutions in Kathmandu

Share Kathmandu University's ranking

Kathmandu University on Science Explorer

A card with Kathmandu University's standing and the fields it leads in, for a post or a slide. A link to this page previews as the same card.

Download the card

1200 × 630 PNG, sized for social posts, drawn from the latest snapshot.

Badges for a website1Each links back here and updates with every snapshot

Research measures only: rankings here say nothing about teaching, admissions or student experience. Comparable institutions and collaboration partners have tabs of their own, above.

Discussion

Ask a question or share a note about Kathmandu University. Posts are plain text and can be reported.