Sechenov University
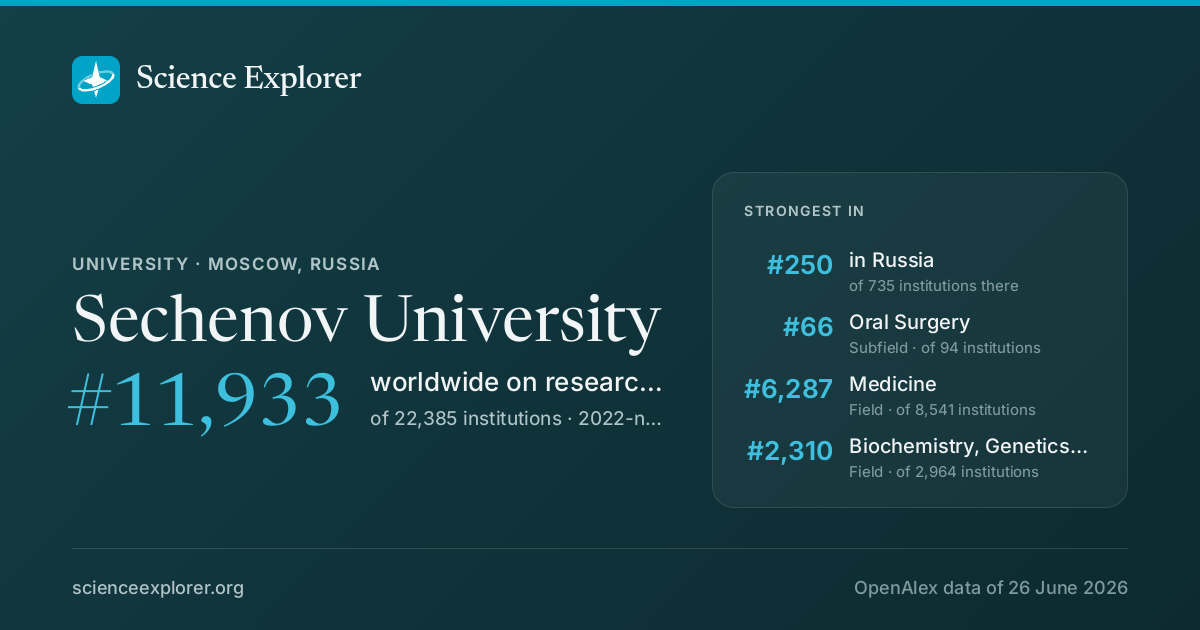
In research, Sechenov University stands highest in Oral Surgery (#66 of 94 worldwide), Medicine (#6,287 of 8,541 worldwide) and Biochemistry, Genetics and Molecular Biology (#2,310 of 2,964 worldwide), 2022-now. Relative to its size it is most specialised in Anatomy, Complementary and Manual Therapy and Dermatology (Anatomy is 23.4× its share of world research).
- World rank, 2022-now
- #11,933 of 22,385 · #6,155 all time
- Rank in Russia
- #250 of 735
- Research works
- 18k ◆ 1% vs 2018-21
- Citations
- 107k 6.1 per fractional work
- Top-10% rate
- 5.2% all institutions 10.0%
- vs its own fields
- 0.53× 1.00× is exactly expected
- Open access
- 66% world 40%
- International
- 19% world 18%
What is Sechenov University known for in research?
The fields where it stands highest, 2022-now, ranked among every institution above the floor in each field.
| Field | World rank | Where that sits | Top-10% rate | Works | All time |
|---|---|---|---|---|---|
| Oral SurgerySubfield | #66 of 94 | 8.3% | 67 | #251 | |
| MedicineField | #6,287 of 8,541 | 4.5% | 3,854 | #4042 | |
| Biochemistry, Genetics and Molecular BiologyField | #2,310 of 2,964 | 4.5% | 588 | #2483 | |
| EpidemiologySubfield | #757 of 927 | 8.2% | 353 | #1197 | |
| Health SciencesDomain | #8,187 of 9,902 | 4.6% | 4,217 | #5067 | |
| DentistryField | #336 of 405 | 8.1% | 148 | #533 | |
| SurgerySubfield | #1,278 of 1,532 | 4.2% | 490 | #1988 | |
| Molecular BiologySubfield | #1,619 of 1,880 | 5.1% | 294 | #2130 | |
| RheumatologySubfield | #286 of 320 | 3.8% | 139 | #658 | |
| Pharmacology, Toxicology and PharmaceuticsField | #143 of 160 | 6.0% | 66 | #660 |
Each strip is that field's whole ranked pool, with the notch where Sechenov University sits in it, in the colour of the band that rank falls in. The track under the rate is the rate itself: it carries no average mark, because the average differs by field (from about 6% in Dentistry to 21% in Economics).
Which of those standings moved
The same fields on both windows: where it stood over the whole record, and where it stands in 2022-now. The distance is the story, and it is the one thing the two rank columns above cannot show.
- Oral Surgery#251 #66
- Medicine#4,042 #6,287
- Biochemistry, Genetics and Molecular Biology#2,483 #2,310
- Epidemiology#1,197 #757
- Health Sciences#5,067 #8,187
- Dentistry#533 #336
- Surgery#1,988 #1,278
- Molecular Biology#2,130 #1,619
- Rheumatology#658 #286
- Pharmacology, Toxicology and Pharmaceutics#660 #143
A dot further right is a better standing. Fields it was not ranked in over the whole record are left out.
Which fields of science does Sechenov University work in?
In 2022-now, 67% of research at Sechenov University is in Health Sciences, 19% in Life Sciences. Its largest fields are Medicine (61%), Biochemistry, Genetics and Molecular Biology (9%), Neuroscience (4%). It does 2.9× the world's share of Health Sciences.
Each ring splits the one inside it: the four domains of science, their fields, their subfields. Size is fractional works in 2022-now. Every slice is a page; the interactive view zooms down to single topics and colours each by how much more of it this institution does than the world.
Its 4 domains and 26 fields, with their numbers
- Health Sciences4,71566.9%
- Medicine4,30761.1%
- Health Professions1742.5%
- Dentistry1702.4%
- Nursing560.8%
- Veterinary90.1%
- Life Sciences1,31118.6%
- Physical Sciences6058.6%
- Engineering2163.1%
- Materials Science961.4%
- Chemistry831.2%
- Computer Science791.1%
- Environmental Science610.9%
- Physics and Astronomy320.5%
- Mathematics180.3%
- Energy70.1%
- Chemical Engineering60.1%
- Earth and Planetary Sciences50.1%
- Social Sciences4185.9%
- Social Sciences1652.3%
- Psychology1271.8%
- Arts and Humanities520.7%
- Economics, Econometrics and Finance350.5%
- Decision Sciences210.3%
- Business, Management and Accounting190.3%
What does Sechenov University specialise in?
Where its research is concentrated relative to its size: Anatomy takes 23.4× the share of its output that it takes of world research.
- AnatomySubfield · 39.4 works23×
- Complementary and Manual TherapySubfield · 23.2 works7.9×
- DermatologySubfield · 123.2 works6.7×
- NeurologySubfield · 114.7 works5.9×
- GastroenterologySubfield · 48.4 works5.8×
- Oral SurgerySubfield · 74.0 works5.5×
- Internal MedicineSubfield · 22.2 works5.2×
- Immunology and AllergySubfield · 28.2 works5.0×
Location quotient, a volume reading rather than an impact one. It surfaces small, lopsided specialities.
Field profile
Location quotient across every field it publishes in: outside the ring is more than an institution of this size would be expected to publish, inside it is less.
Rings at 0.5×, 1× and 2×. Widest outward: Dentistry, 5.0×. Every wedge is a field page.
All 26 fields, with their numbers
- Dentistry4.96×170 works
- Medicine3.18×4,307 works
- Pharmacology, Toxicology and Pharmaceutics2.97×74 works
- Immunology and Microbiology2.60×185 works
- Neuroscience2.31×264 works
- Biochemistry, Genetics and Molecular Biology1.74×653 works
- Nursing1.62×56 works
- Health Professions0.93×174 works
- Veterinary0.91×9 works
- Chemistry0.75×83 works
- Psychology0.59×127 works
- Agricultural and Biological Sciences0.40×135 works
- Materials Science0.39×96 works
- Decision Sciences0.30×21 works
- Arts and Humanities0.26×52 works
- Chemical Engineering0.24×6 works
- Economics, Econometrics and Finance0.23×35 works
- Mathematics0.22×18 works
- Physics and Astronomy0.21×32 works
- Engineering0.20×216 works
- Social Sciences0.18×165 works
- Environmental Science0.17×61 works
- Computer Science0.14×79 works
- Energy0.11×7 works
- Business, Management and Accounting0.08×19 works
- Earth and Planetary Sciences0.05×5 works
- Dentistry 5.0×
- Medicine 3.2×
- Pharmacology, Toxicology and Pharmaceutics 3.0×
- Immunology and Microbiology 2.6×
- Neuroscience 2.3×
- Biochemistry, Genetics and Molecular Biology 1.7×
- Nursing 1.6×
- Health Professions 0.9×
- Veterinary 0.9×
- Chemistry 0.8×
- Psychology 0.6×
- Agricultural and Biological Sciences 0.4×
- Materials Science 0.4×
- Decision Sciences 0.3×
- Arts and Humanities 0.3×
- Chemical Engineering 0.2×
- Economics, Econometrics and Finance 0.2×
- Mathematics 0.2×
- Physics and Astronomy 0.2×
- Engineering 0.2×
- Social Sciences 0.2×
- Environmental Science 0.2×
- Computer Science 0.1×
- Energy 0.1×
- Business, Management and Accounting 0.1×
- Earth and Planetary Sciences 0.1×
Who are the top researchers at Sechenov University?
Ranked on the quality score, Daniel Munblit, Platon D Lopukhov and Ekaterina Gilyarova lead among researchers whose main affiliation is Sechenov University.
- 1
Daniel Munblit
 Russia · #68,214 worldwide
11k citations · 207 works
- 2
Platon D Lopukhov
Russia · #93,039 worldwide
53k citations · 58 works
- 3
Ekaterina Gilyarova
Russia · #167,387 worldwide
1.3k citations · 26 works
- 4
Alexander N. Lukashev
Russia · #251,265 worldwide
6.9k citations · 182 works
- 5
Elena V Poddubskaya
Russia · #294,041 worldwide
23k citations · 119 works
- 6
Vladimir Andreevich Korshunov
Russia · #388,841 worldwide
33k citations · 53 works
- 7
Nikita A. Nekliudov
Russia · #402,774 worldwide
2.5k citations · 34 works
- 8
Alessandro Parodi
Russia · #433,417 worldwide
6.8k citations · 296 works
- 9
Francesco Guido Mangano
Russia · #540,723 worldwide
8.8k citations · 183 works
- 10
Р. В. Полибин
Russia · #566,115 worldwide
41k citations · 91 works
Which keywords describe research at Sechenov University?
By fractional works in 2022-now, weighted toward what it does more of than the world: Epidemiology, Inflammation, Oxidative Stress, Prevention, Risk Factors, Treatment, Diagnosis and Quality of Life.
- Adolescent Health
- Retinal Ganglion Cells
- Mitochondrial Dysfunction
- Pathophysiology
- Heart Failure
- Guidelines
- Global Burden
- Arctic Population
- Immune Response
- Epidemiological Studies
- Obesity
- Clinical Trials
- Complications
- Clinical Practice Guidelines
- Management
- Prevention
- Cardiovascular Disease
- Quality of Life
- Treatment
- Inflammation
- Epidemiology
- Oxidative Stress
- Risk Factors
- Diagnosis
- Public Health
- Cancer
- Metabolic Syndrome
- Neurological Disorders
- Chemotherapy
- Cardiovascular Diseases
- Non-Communicable Diseases
- Occupational Health
- Healthcare Policy
- Mortality Trends
- Pathogenesis
- Neuroprotection
- Alzheimer's Disease
- Autoantibodies
- Hypertension
- Glaucoma
Size is fractional works in 2022-now in the topics tagged with each word; colour is the word's share of this institution's work against its share of the world's. The 40 words are chosen for being large and distinctive. Each links to the topic it comes from most.
All 40 words, with their numbers
- Epidemiology855▲ 3.0×133 topics
- Inflammation503▲ 3.4×83 topics
- Oxidative Stress436▲ 3.8×62 topics
- Treatment315▲ 3.7×50 topics
- Risk Factors306▲ 3.9×35 topics
- Quality of Life296▲ 2.9×49 topics
- Diagnosis280▲ 4.3×41 topics
- Cardiovascular Disease245▲ 3.0×39 topics
- Public Health237▲ 2.3×56 topics
- Prevention235▲ 7.9×16 topics
- Cancer203▲ 2.1×59 topics
- Management201▲ 3.6×34 topics
- Metabolic Syndrome188▲ 3.3×23 topics
- Clinical Practice Guidelines146▲ 3.8×14 topics
- Neurological Disorders146▲ 3.6×20 topics
- Complications144▲ 4.1×17 topics
- Chemotherapy142▲ 2.9×25 topics
- Clinical Trials142▲ 3.0×19 topics
- Cardiovascular Diseases141▲ 23×4 topics
- Obesity136▲ 2.5×26 topics
- Non-Communicable Diseases134▲ 7.0×5 topics
- Epidemiological Studies134▲ 14×3 topics
- Occupational Health133▲ 17×6 topics
- Immune Response133▲ 3.3×22 topics
- Healthcare Policy132▲ 21×2 topics
- Arctic Population131▲ 49×1 topic
- Mortality Trends131▲ 49×1 topic
- Global Burden123▲ 3.2×12 topics
- Pathogenesis121▲ 3.4×23 topics
- Guidelines119▲ 3.6×13 topics
- Neuroprotection118▲ 4.7×17 topics
- Heart Failure117▲ 3.7×14 topics
- Alzheimer's Disease108▲ 5.5×9 topics
- Pathophysiology107▲ 5.2×11 topics
- Autoantibodies106▲ 6.4×8 topics
- Mitochondrial Dysfunction104▲ 5.0×12 topics
- Hypertension96▲ 4.7×16 topics
- Retinal Ganglion Cells85▲ 11×3 topics
- Glaucoma85▲ 8.0×4 topics
- Adolescent Health80▲ 14×3 topics
Which research topics does Sechenov University publish most on?
By volume in 2022-now: Healthcare Systems and Public Health, Human Health and Disease, Neurological Disorders and Treatments and COVID-19 Clinical Research Studies.
Area is fractional works; colour is the subfield each topic belongs to.
- 1 Healthcare Systems and Public Health Epidemiology 131 works
- 2 Human Health and Disease Pediatrics, Perinatology and Child Health 73 works
- 3 Neurological Disorders and Treatments Neurology 63 works
- 4 COVID-19 Clinical Research Studies Infectious Diseases 46 works
- 5 Long-Term Effects of COVID-19 Neurology 41 works
- 6 Medical and Biological Sciences Anatomy 39 works
- 7 Migraine and Headache Studies Psychiatry and Mental health 33 works
- 8 Musculoskeletal pain and rehabilitation Pharmacology 32 works
- 9 Pediatric health and respiratory diseases Emergency Medical Services 30 works
- 10 Liver Disease Diagnosis and Treatment Epidemiology 30 works
How open and international is its research?
Against the world's own shares: the tick on each track. Both are shares of its output, so they sit on one scale and can be read against each other as well as against the world.
World: 40% of research is openly available.
World: 18% is written across borders.
How has Sechenov University's research output changed?
Output in 2022-2025 was 1% higher than in 2018-2021.
The same series as a ribbon: one cell per year, darker for more. The line above answers how much; this answers when.
Its share of all research
Growing output can still be a shrinking share: all of science grows. This is Sechenov University as a percentage of every work published that year, 0.029% in 2024.
Fractional works of Sechenov University over all fractional works that year. How the balance of science has shifted.
How much of it reaches the world top 10%
Year by year, against all institutions in the same year.
Of each year's output, the share that reached the world's 10% most cited for its field and year. Peak 7.0% in 2020.
Other research institutions in Moscow
- Russian Academy of Sciences
- Lomonosov Moscow State University
- National Research University Higher School of Economics
- Peoples' Friendship University of Russia
- Bauman Moscow State Technical University
- Kurchatov Institute
- National Research Nuclear University MEPhI
- Ministry of Health of the Russian Federation


Share Sechenov University's ranking
Badges for a website1Each links back here and updates with every snapshot

Research measures only: rankings here say nothing about teaching, admissions or student experience. Comparable institutions and collaboration partners have tabs of their own, above.
Discussion
Ask a question or share a note about Sechenov University. Posts are plain text and can be reported.