UCSI University
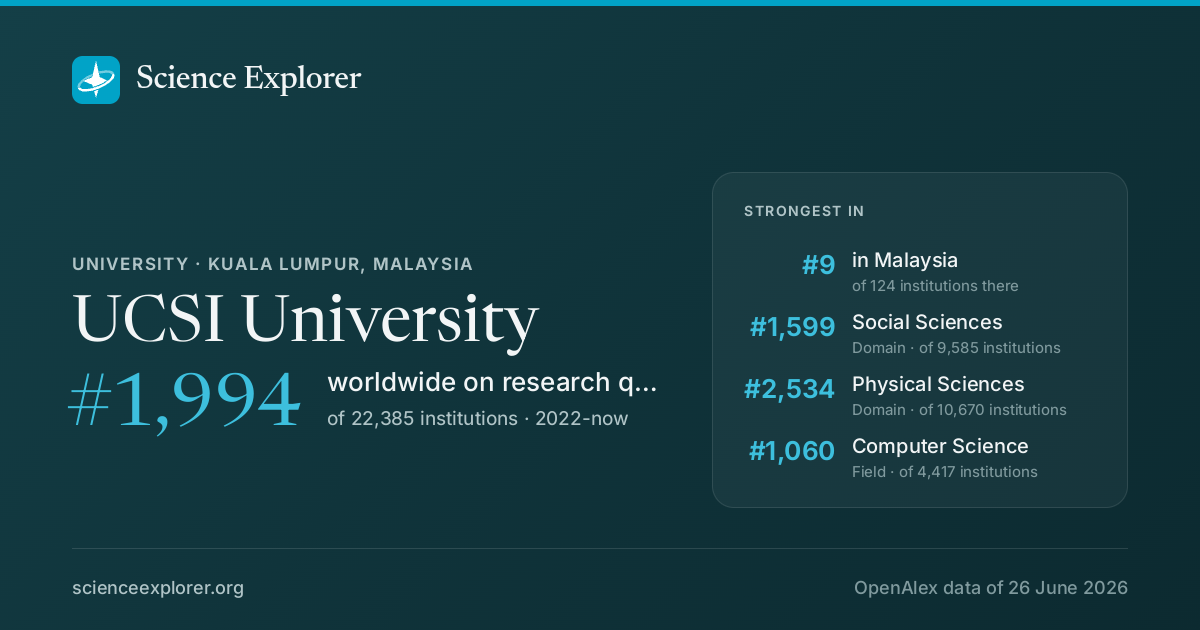
In research, UCSI University stands highest in Social Sciences (#1,599 of 9,585 worldwide), Physical Sciences (#2,534 of 10,670 worldwide) and Computer Science (#1,060 of 4,417 worldwide), 2022-now. Relative to its size it is most specialised in Marketing and Information Systems and Management (Marketing is 6.0× its share of world research).
- World rank, 2022-now
- #1,994 of 22,385 · #2,923 all time
- Rank in Malaysia
- #9 of 124
- Research works
- 4.2k ▲ 58% vs 2018-21
- Citations
- 52k 12.5 per fractional work
- Top-10% rate
- 13.0% all institutions 10.0%
- vs its own fields
- 0.98× 1.00× is exactly expected
- Open access
- 61% world 40%
- International
- 36% world 18%
What is UCSI University known for in research?
The fields where it stands highest, 2022-now, ranked among every institution above the floor in each field.
| Field | World rank | Where that sits | Top-10% rate | Works | All time |
|---|---|---|---|---|---|
| Social SciencesDomain | #1,599 of 9,585 | 16.8% | 735 | #1988 | |
| Physical SciencesDomain | #2,534 of 10,670 | 9.9% | 730 | #3012 | |
| Computer ScienceField | #1,060 of 4,417 | 12.8% | 205 | #1559 | |
| Business, Management and AccountingField | #675 of 2,581 | 19.5% | 180 | #1066 | |
| EngineeringField | #1,770 of 5,901 | 9.6% | 293 | #2651 | |
| Health SciencesDomain | #4,022 of 9,902 | 11.8% | 245 | #6435 | |
| Life SciencesDomain | #2,696 of 6,403 | 11.5% | 199 | #3736 | |
| Social SciencesField | #2,681 of 5,988 | 17.7% | 253 | #2923 | |
| MedicineField | #4,208 of 8,541 | 11.5% | 185 | #6665 | |
| PsychologyField | #1,069 of 2,121 | 10.8% | 124 | #1536 |
Each strip is that field's whole ranked pool, with the notch where UCSI University sits in it, in the colour of the band that rank falls in. The track under the rate is the rate itself: it carries no average mark, because the average differs by field (from about 6% in Dentistry to 21% in Economics).
Which of those standings moved
The same fields on both windows: where it stood over the whole record, and where it stands in 2022-now. The distance is the story, and it is the one thing the two rank columns above cannot show.
- Social Sciences#1,988 #1,599
- Physical Sciences#3,012 #2,534
- Computer Science#1,559 #1,060
- Business, Management and Accounting#1,066 #675
- Engineering#2,651 #1,770
- Health Sciences#6,435 #4,022
- Life Sciences#3,736 #2,696
- Social Sciences#2,923 #2,681
- Medicine#6,665 #4,208
- Psychology#1,536 #1,069
A dot further right is a better standing. Fields it was not ranked in over the whole record are left out.
Which fields of science does UCSI University work in?
In 2022-now, 40% of research at UCSI University is in Social Sciences, 38% in Physical Sciences. Its largest fields are Engineering (15%), Social Sciences (14%), Computer Science (11%). It does 1.6× the world's share of Social Sciences.
Each ring splits the one inside it: the four domains of science, their fields, their subfields. Size is fractional works in 2022-now. Every slice is a page; the interactive view zooms down to single topics and colours each by how much more of it this institution does than the world.
Its 4 domains and 26 fields, with their numbers
- Social Sciences84739.6%
- Social Sciences29413.7%
- Business, Management and Accounting2059.6%
- Psychology1466.9%
- Arts and Humanities924.3%
- Decision Sciences612.8%
- Economics, Econometrics and Finance502.3%
- Physical Sciences80337.5%
- Engineering31814.9%
- Computer Science22910.7%
- Environmental Science1004.7%
- Materials Science663.1%
- Chemistry281.3%
- Energy241.1%
- Mathematics120.6%
- Physics and Astronomy100.5%
- Earth and Planetary Sciences100.4%
- Chemical Engineering50.2%
- Health Sciences27012.6%
- Medicine2029.4%
- Health Professions462.2%
- Nursing200.9%
- Dentistry10.1%
- Veterinary10.0%
- Life Sciences21810.2%
What does UCSI University specialise in?
Where its research is concentrated relative to its size: Marketing takes 6.0× the share of its output that it takes of world research.
- MarketingSubfield · 54.1 works6.0×
- Information Systems and ManagementSubfield · 34.8 works5.7×
Location quotient, a volume reading rather than an impact one. It surfaces small, lopsided specialities.
Field profile
Location quotient across every field it publishes in: outside the ring is more than an institution of this size would be expected to publish, inside it is less.
Rings at 0.5×, 1× and 2×. Widest outward: Business, Management and Accounting, 3.0×. Every wedge is a field page.
All 26 fields, with their numbers
- Business, Management and Accounting2.98×205 works
- Decision Sciences2.94×61 works
- Pharmacology, Toxicology and Pharmaceutics2.68×20 works
- Psychology2.25×146 works
- Nursing1.88×20 works
- Arts and Humanities1.48×92 works
- Computer Science1.38×229 works
- Energy1.23×24 works
- Social Sciences1.09×294 works
- Economics, Econometrics and Finance1.08×50 works
- Engineering0.99×318 works
- Agricultural and Biological Sciences0.95×96 works
- Environmental Science0.95×100 works
- Materials Science0.89×66 works
- Chemistry0.84×28 works
- Health Professions0.82×46 works
- Chemical Engineering0.67×5 works
- Biochemistry, Genetics and Molecular Biology0.63×72 works
- Neuroscience0.60×21 works
- Mathematics0.49×12 works
- Medicine0.49×202 works
- Immunology and Microbiology0.43×9 works
- Earth and Planetary Sciences0.29×10 works
- Veterinary0.28×1 works
- Physics and Astronomy0.22×10 works
- Dentistry0.12×1 works
- Business, Management and Accounting 3.0×
- Decision Sciences 2.9×
- Pharmacology, Toxicology and Pharmaceutics 2.7×
- Psychology 2.2×
- Nursing 1.9×
- Arts and Humanities 1.5×
- Computer Science 1.4×
- Energy 1.2×
- Social Sciences 1.1×
- Economics, Econometrics and Finance 1.1×
- Engineering 1.0×
- Agricultural and Biological Sciences 0.9×
- Environmental Science 0.9×
- Materials Science 0.9×
- Chemistry 0.8×
- Health Professions 0.8×
- Chemical Engineering 0.7×
- Biochemistry, Genetics and Molecular Biology 0.6×
- Neuroscience 0.6×
- Mathematics 0.5×
- Medicine 0.5×
- Immunology and Microbiology 0.4×
- Earth and Planetary Sciences 0.3×
- Veterinary 0.3×
- Physics and Astronomy 0.2×
- Dentistry 0.1×
Who are the top researchers at UCSI University?
Ranked on the quality score, Keng‐Boon Ooi, Garry Wei‐Han Tan and Eugene Cheng‐Xi Aw lead among researchers whose main affiliation is UCSI University.
- 1
Keng‐Boon Ooi
 Malaysia · #311 worldwide
27k citations · 262 works
- 2
Garry Wei‐Han Tan
Malaysia · #5,825 worldwide
17k citations · 192 works
- 3
Eugene Cheng‐Xi Aw
Malaysia · #10,796 worldwide
5.7k citations · 126 works
- 4
Ahsan Anwar
Malaysia · #28,981 worldwide
4.3k citations · 68 works
- 5
Tat‐Huei Cham
Malaysia · #40,604 worldwide
7.8k citations · 154 works
- 6
Shayla Islam
Malaysia · #74,200 worldwide
5.9k citations · 213 works
- 7
Hiram Ting
Malaysia · #213,807 worldwide
15k citations · 191 works
- 8
Mosharrof Hosen
Malaysia · #235,995 worldwide
840 citations · 73 works
- 9
Lai‐Wan Wong
Malaysia · #236,565 worldwide
3.8k citations · 22 works
- 10
Omkar Dastane
Malaysia · #376,093 worldwide
1.4k citations · 96 works
Which keywords describe research at UCSI University?
By fractional works in 2022-now, weighted toward what it does more of than the world: Machine Learning, Consumer Behavior, Deep Learning, Supply Chain Management, User Satisfaction, Social Media, Sustainability and Information Systems.
- Green Consumption
- Customer Experience
- Ethical Consumption
- Virtual Reality
- Partial Least Squares
- Electronic Word-of-Mouth
- User-Generated Content
- Technology Acceptance Model
- Information Systems
- E-commerce
- Well-being
- Social Capital
- Educational Technology
- Healthcare
- Renewable Energy
- Environmental Impact
- Artificial Intelligence
- Consumer Behavior
- Social Media
- Deep Learning
- Machine Learning
- Sustainability
- Supply Chain Management
- Education
- Mental Health
- Internet of Things
- Antioxidant
- Biomedical Applications
- Environmental Management
- User Satisfaction
- Leadership
- Risk Management
- Structural Equation Modeling
- Online Shopping
- Consumer Engagement
- Consumer Trust
- Student Engagement
- Self-Efficacy
- Student Perceptions
- Environmental Innovation
Size is fractional works in 2022-now in the topics tagged with each word; colour is the word's share of this institution's work against its share of the world's. The 40 words are chosen for being large and distinctive. Each links to the topic it comes from most.
All 40 words, with their numbers
- Machine Learning110▲ 1.55×75 topics
- Deep Learning103▲ 1.40×74 topics
- Sustainability80▲ 1.54×66 topics
- Social Media66▲ 2.2×25 topics
- Supply Chain Management59▲ 3.1×18 topics
- Consumer Behavior58▲ 4.3×17 topics
- Education53▲ 1.45×46 topics
- Artificial Intelligence53▲ 1.74×37 topics
- Mental Health53▲ 1.73×35 topics
- Environmental Impact53▲ 1.45×45 topics
- Internet of Things48▲ 2.6×26 topics
- Renewable Energy47▲ 1.52×38 topics
- Antioxidant47▲ 3.2×42 topics
- Healthcare45▲ 1.84×17 topics
- Biomedical Applications41▲ 1.62×30 topics
- Educational Technology40▲ 1.56×28 topics
- Environmental Management38▲ 4.4×9 topics
- Social Capital37▲ 3.4×11 topics
- User Satisfaction36▲ 9.0×4 topics
- Well-being36▲ 4.3×13 topics
- Leadership34▲ 3.2×17 topics
- E-commerce33▲ 2.8×9 topics
- Risk Management33▲ 3.2×14 topics
- Information Systems32▲ 8.5×5 topics
- Structural Equation Modeling31▲ 7.5×5 topics
- Technology Acceptance Model30▲ 9.2×2 topics
- Online Shopping30▲ 8.0×2 topics
- User-Generated Content30▲ 10×2 topics
- Consumer Engagement29▲ 11×1 topic
- Electronic Word-of-Mouth29▲ 11×1 topic
- Consumer Trust29▲ 14×1 topic
- Partial Least Squares29▲ 14×1 topic
- Student Engagement29▲ 3.4×15 topics
- Virtual Reality29▲ 2.8×16 topics
- Self-Efficacy26▲ 4.6×10 topics
- Ethical Consumption23▲ 10×2 topics
- Student Perceptions22▲ 5.7×7 topics
- Customer Experience20▲ 5.9×3 topics
- Environmental Innovation20▲ 10×1 topic
- Green Consumption20▲ 10×1 topic
Which research topics does UCSI University publish most on?
By volume in 2022-now: Digital Marketing and Social Media, Technology Adoption and User Behaviour, Environmental Sustainability in Business and Consumer Behavior in Brand Consumption and Identification.
Area is fractional works; colour is the subfield each topic belongs to.
- 1 Digital Marketing and Social Media Sociology and Political Science 29 works
- 2 Technology Adoption and User Behaviour Information Systems and Management 29 works
- 3 Environmental Sustainability in Business Marketing 20 works
- 4 Consumer Behavior in Brand Consumption and Identification Marketing 13 works
- 5 Impact of Technology on Adolescents Sociology and Political Science 11 works
- 6 Consumer Retail Behavior Studies Marketing 11 works
- 7 Entrepreneurship Studies and Influences Management of Technology and Innovation 11 works
- 8 Sustainable Supply Chain Management Strategy and Management 10 works
- 9 Online Learning and Analytics Computer Science Applications 10 works
- 10 Construction Project Management and Performance Management Science and Operations Research 10 works
How open and international is its research?
Against the world's own shares: the tick on each track. Both are shares of its output, so they sit on one scale and can be read against each other as well as against the world.
World: 40% of research is openly available.
World: 18% is written across borders.
How has UCSI University's research output changed?
Output in 2022-2025 was 58% higher than in 2018-2021.
The same series as a ribbon: one cell per year, darker for more. The line above answers how much; this answers when.
Its share of all research
Growing output can still be a shrinking share: all of science grows. This is UCSI University as a percentage of every work published that year, 0.0086% in 2024.
Fractional works of UCSI University over all fractional works that year. How the balance of science has shifted.
How much of it reaches the world top 10%
Year by year, against all institutions in the same year.
Of each year's output, the share that reached the world's 10% most cited for its field and year. Peak 14.7% in 2014.
Other research institutions in Kuala Lumpur
- University of Malaya
- National University of Malaysia
- International Islamic University Malaysia
- Sultan Idris Education University
- University of Kuala Lumpur
- Petronas (Malaysia)
- IMU University
- National Defence University of Malaysia
Share UCSI University's ranking
Badges for a website1Each links back here and updates with every snapshot

Research measures only: rankings here say nothing about teaching, admissions or student experience. Comparable institutions and collaboration partners have tabs of their own, above.
Discussion
Ask a question or share a note about UCSI University. Posts are plain text and can be reported.