 Science in China
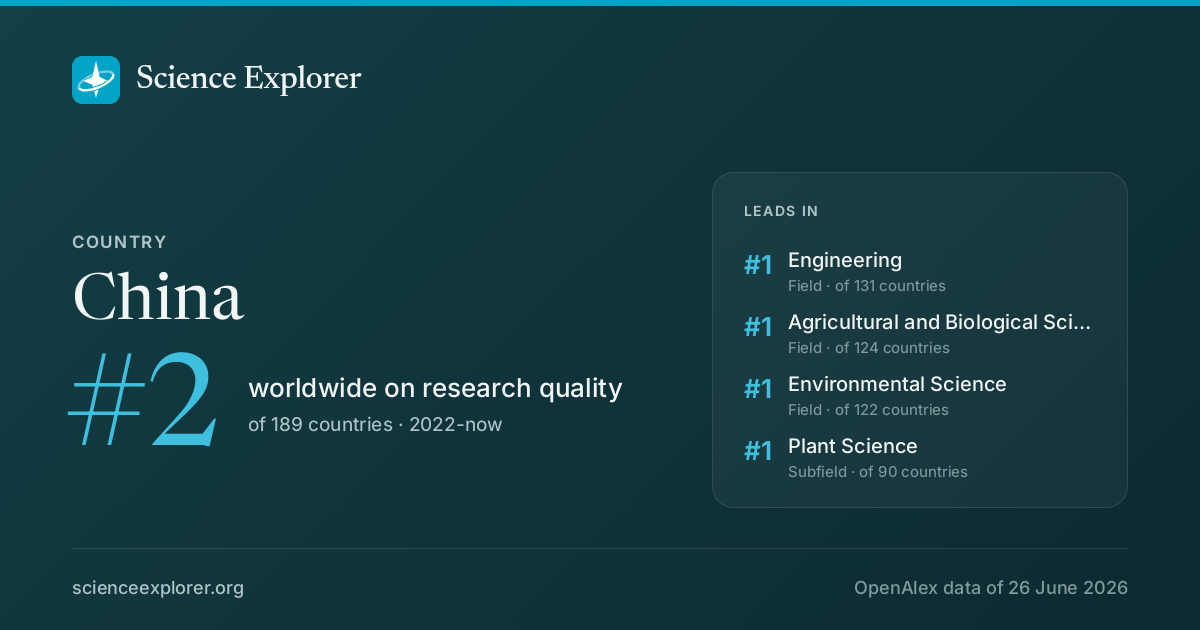
China ranks #2 of 189 countries on research quality in 2022-now (#2 all time), with 4M research works and 13.3% of them in the world's top 10%.
- World rank, 2022-now
- #2 of 189 · #2 all time
- Works, 2022-now
- 4M ▲ 62% vs 2018-21
- Citations
- 202M 14.0 per fractional work, all time
- Top-10% rate
- 13.3% all institutions 10.0%
- vs its own fields
- 1.20× 1.00× is exactly expected
- In the world top 100
- 31 243 in the top 1,000
- Open access
- 30% world 40%
- International
- 12% world 18%
ChinaWhat is China strongest at in science?
On research quality in 2022-now, China ranks highest in Engineering (#1 of 131), Agricultural and Biological Sciences (#1 of 124) and Environmental Science (#1 of 122). Relative to its size it is most specialised in General Engineering, Acoustics and Ultrasonics and Catalysis.
| Field | World rank | Where that sits | Top-10% rate | Works | All time | Institutions |
|---|---|---|---|---|---|---|
| EngineeringField | #1 of 131 | 12.9% | 1,118,518 | #1 | Institutions | |
| Agricultural and Biological SciencesField | #1 of 124 | 17.3% | 156,789 | #2 | Institutions | |
| Environmental ScienceField | #1 of 122 | 13.9% | 237,727 | #1 | Institutions | |
| Plant ScienceSubfield | #1 of 90 | 16.0% | 75,650 | - | Institutions | |
| Materials ScienceField | #1 of 87 | 13.0% | 275,216 | #1 | Institutions | |
| Electrical and Electronic EngineeringSubfield | #1 of 86 | 11.8% | 284,718 | #1 | Institutions | |
| Biomedical EngineeringSubfield | #1 of 78 | 13.0% | 133,947 | #1 | Institutions | |
| Strategy and ManagementSubfield | #1 of 77 | 14.7% | 16,824 | - | Institutions | |
| MedicineField | #2 of 152 | 14.0% | 582,555 | - | Institutions | |
| Social SciencesField | #2 of 148 | 14.5% | 124,414 | - | Institutions | |
| Mechanical EngineeringSubfield | #1 of 74 | 13.4% | 145,793 | #1 | Institutions | |
| Food ScienceSubfield | #1 of 72 | 18.3% | 24,425 | - | Institutions |
Where its research is concentrated
Location quotient: how much more (or less) of each node it does than its size predicts. Drawn around 1×, where "twice the world share" and "half of it" are the same distance apart in opposite directions. A volume reading, which on a country axis is largely population and industrial structure.
- General EngineeringSubfield · 1,250.0 works · #1 of 96 active here3.6×
- Acoustics and UltrasonicsSubfield · 1,288.1 works · #1 of 108 active here2.4×
- CatalysisSubfield · 16,437.5 works · #1 of 168 active here2.4×
- Process Chemistry and TechnologySubfield · 4,299.6 works · #1 of 151 active here2.3×
- Computational MathematicsSubfield · 934.0 works · #1 of 117 active here2.2×
- Ceramics and CompositesSubfield · 7,076.9 works · #1 of 155 active here2.2×
- Computer Vision and Pattern RecognitionSubfield · 125,187.4 works · #1 of 204 active here2.1×
- Control and Systems EngineeringSubfield · 107,124.7 works · #1 of 205 active here2.1×
The whole field profile
All 26 fields at once. A specialist and a generalist produce the same ranked list and a completely different shape.
Rings at 0.5×, 1× and 2×. Widest outward: Chemical Engineering, 1.9×. Every wedge is a field page.
All 26 fields, with their numbers
- Chemical Engineering1.94×31k works
- Materials Science1.94×313k works
- Energy1.91×81k works
- Engineering1.83×1.3M works
- Chemistry1.53×111k works
- Biochemistry, Genetics and Molecular Biology1.39×342k works
- Earth and Planetary Sciences1.33×97k works
- Computer Science1.29×463k works
- Immunology and Microbiology1.22×57k works
- Environmental Science1.19×272k works
- Physics and Astronomy1.14×117k works
- Pharmacology, Toxicology and Pharmaceutics1.05×17k works
- Neuroscience0.97×73k works
- Nursing0.87×20k works
- Agricultural and Biological Sciences0.84×183k works
- Mathematics0.81×44k works
- Decision Sciences0.79×35k works
- Medicine0.77×680k works
- Economics, Econometrics and Finance0.61×60k works
- Dentistry0.50×11k works
- Business, Management and Accounting0.50×74k works
- Psychology0.46×65k works
- Veterinary0.41×2,562 works
- Health Professions0.25×31k works
- Social Sciences0.24×140k works
- Arts and Humanities0.20×27k works
Which fields of science does China work in?
In 2022-now, 61% of research in China is in Physical Sciences, 16% in Health Sciences. Its largest fields are Engineering (27%), Medicine (15%), Computer Science (10%). It does 1.6× the world's share of Physical Sciences.
Each ring splits the one inside it: the four domains of science, their fields, their subfields. Size is fractional works in 2022-now. Every slice is a page; the interactive view zooms down to single topics and colours each by how much more of it this country does than the world.
Its 4 domains and 26 fields, with their numbers
- Physical Sciences2.8M60.6%
- Engineering1.3M27.4%
- Computer Science463k10.0%
- Materials Science313k6.8%
- Environmental Science272k5.9%
- Physics and Astronomy117k2.5%
- Chemistry111k2.4%
- Earth and Planetary Sciences97k2.1%
- Energy81k1.8%
- Mathematics44k1.0%
- Chemical Engineering31k0.7%
- Health Sciences744k16.1%
- Medicine680k14.7%
- Health Professions31k0.7%
- Nursing20k0.4%
- Dentistry11k0.2%
- Veterinary2,5620.1%
- Life Sciences672k14.6%
- Social Sciences402k8.7%
- Social Sciences140k3.0%
- Business, Management and Accounting74k1.6%
- Psychology65k1.4%
- Economics, Econometrics and Finance60k1.3%
- Decision Sciences35k0.8%
- Arts and Humanities27k0.6%
Which keywords describe research in China?
By fractional works in 2022-now, weighted toward what it does more of than the world: Deep Learning, Machine Learning, Neural Networks, Nanomaterials, Cancer, Biomedical Applications, Nanoparticles and Inflammation.
- CO2 Reduction
- Battery Technology
- Reactive Oxygen Species
- Electrocatalysis
- Wireless Sensor Networks
- Biosensors
- Drug Delivery
- Microstructure
- Metal-Organic Frameworks
- Gene Expression
- Convolutional Neural Networks
- Nanocomposites
- Energy Storage
- Renewable Energy
- Remote Sensing
- Biomedical Applications
- Nanoparticles
- Climate Change
- Inflammation
- Machine Learning
- Deep Learning
- Neural Networks
- Epidemiology
- Cancer
- Nanomaterials
- Oxidative Stress
- Mechanical Properties
- Environmental Impact
- Graphene
- Catalysis
- Energy Efficiency
- Internet of Things
- Cathode Materials
- Water Splitting
- Lithium-ion Batteries
- Tumor Microenvironment
- Semiconductor
- Rechargeable Batteries
- Smart Grid
- Hydrogen Production
Size is fractional works in 2022-now in the topics tagged with each word; colour is the word's share of this country's work against its share of the world's. The 40 words are chosen for being large and distinctive. Each links to the topic it comes from most.
All 40 words, with their numbers
- Deep Learning294k▲ 1.85×85 topics
- Machine Learning186k▲ 1.21×97 topics
- Neural Networks133k▲ 1.87×42 topics
- Inflammation123k▲ 1.25×83 topics
- Epidemiology112k▼ 0.61×140 topics
- Climate Change110k◆ 0.87×132 topics
- Cancer109k▲ 1.76×59 topics
- Nanoparticles103k▲ 1.77×44 topics
- Nanomaterials102k▲ 2.1×21 topics
- Biomedical Applications100k▲ 1.84×36 topics
- Oxidative Stress100k▲ 1.31×63 topics
- Remote Sensing87k▲ 1.55×42 topics
- Mechanical Properties87k▲ 1.92×39 topics
- Renewable Energy86k▲ 1.29×61 topics
- Environmental Impact86k◆ 1.09×74 topics
- Energy Storage78k▲ 2.6×13 topics
- Graphene72k▲ 2.3×12 topics
- Nanocomposites71k▲ 1.95×22 topics
- Catalysis69k▲ 2.2×29 topics
- Convolutional Neural Networks63k▲ 1.87×14 topics
- Energy Efficiency59k▲ 1.39×46 topics
- Gene Expression57k▲ 1.96×20 topics
- Internet of Things55k▲ 1.39×33 topics
- Metal-Organic Frameworks53k▲ 2.8×6 topics
- Cathode Materials53k▲ 3.0×3 topics
- Microstructure51k▲ 2.1×19 topics
- Water Splitting46k▲ 2.7×4 topics
- Drug Delivery46k▲ 1.81×16 topics
- Lithium-ion Batteries43k▲ 2.3×4 topics
- Biosensors43k▲ 1.91×12 topics
- Tumor Microenvironment43k▲ 2.1×8 topics
- Wireless Sensor Networks39k▲ 1.90×23 topics
- Semiconductor37k▲ 2.5×7 topics
- Electrocatalysis37k▲ 2.8×5 topics
- Rechargeable Batteries36k▲ 3.0×2 topics
- Reactive Oxygen Species36k▲ 1.90×14 topics
- Smart Grid34k▲ 2.1×10 topics
- Battery Technology33k▲ 2.6×3 topics
- Hydrogen Production31k▲ 2.5×6 topics
- CO2 Reduction29k▲ 2.9×2 topics
Which research topics does China publish the most in?
Its largest topics in 2022-now are Advanced Photocatalysis Techniques, Advancements in Battery Materials, Electrocatalysts for Energy Conversion.
Area is fractional works in 2022-now; colour is the subfield each topic belongs to. Every tile is a topic page.
- 1 Advanced Photocatalysis Techniques Renewable Energy, Sustainability and the Environment 23k works
- 2 Advancements in Battery Materials Electrical and Electronic Engineering 22k works
- 3 Electrocatalysts for Energy Conversion Renewable Energy, Sustainability and the Environment 18k works
- 4 Advanced Neural Network Applications Computer Vision and Pattern Recognition 17k works
- 5 Advanced Battery Materials and Technologies Electrical and Electronic Engineering 17k works
- 6 Advanced Sensor and Energy Harvesting Materials Biomedical Engineering 15k works
- 7 Advanced battery technologies research Electrical and Electronic Engineering 14k works
- 8 Ferroptosis and cancer prognosis Pulmonary and Respiratory Medicine 14k works
- 9 Catalytic Processes in Materials Science Materials Chemistry 14k works
- 10 Advanced Battery Technologies Research Automotive Engineering 14k works
- 11 Perovskite Materials and Applications Electrical and Electronic Engineering 13k works
- 12 Advanced biosensing and bioanalysis techniques Molecular Biology 13k works
How many world-class institutions does China hold?
Average quality and elite capacity disagree by construction, and both are worth knowing: the first is decided by a country's whole institution population, the second counts the institutions it holds at the top. One square per institution.
| Standing among countries | 2022-now | Where that sits | All time |
|---|---|---|---|
| Average qualityits whole institution population | #2 of 189 | #2 of 203 | |
| Elite capacitythe institutions it holds at the top | #2 of 204 | #2 of 216 |
Elite capacity counts a country's institutions by their worldwide rank, weighted so a place at #1 counts for more than one at #480. Countries under 100 fractional works are left out.
Bands are exclusive, so the squares add up to 243 (the institutions it holds in the world top 1,000), not to four times it.
Which universities in China lead research?
Chinese Academy of Sciences, Tsinghua University and Peking University rank highest in China on research quality in 2022-now.
One dot per institution in the list below. The upper left is the interesting corner.
- 1Chinese Academy of SciencesGovernment institution · Beijing · #2 worldwide15.2% top 10% · 167k works
- 2Tsinghua UniversityUniversity · Beijing · #10 worldwide16.6% top 10% · 48k works
- 3Peking UniversityUniversity · Beijing · #11 worldwide15.3% top 10% · 42k works
- 4Shanghai Jiao Tong UniversityUniversity · Shanghai · #13 worldwide15.2% top 10% · 60k works
- 5Zhejiang UniversityUniversity · Hangzhou · #14 worldwide16.1% top 10% · 56k works
- 6University of Hong KongUniversity · Pok Fu Lam · #19 worldwide18.4% top 10% · 19k works
- 7Sichuan UniversityUniversity · Chengdu · #22 worldwide15.9% top 10% · 47k works
- 8Sun Yat-sen UniversityUniversity · Guangzhou · #24 worldwide14.9% top 10% · 43k works
- 9University of Chinese Academy of SciencesUniversity · Beijing · #27 worldwide16.1% top 10% · 34k works
- 10Wuhan UniversityUniversity · Wuhan · #31 worldwide16.8% top 10% · 29k works
- 11Fudan UniversityUniversity · Shanghai · #34 worldwide14.6% top 10% · 33k works
- 12Nanjing UniversityUniversity · Nanjing · #35 worldwide14.8% top 10% · 19k works
- 13Tongji UniversityUniversity · Shanghai · #37 worldwide15.3% top 10% · 32k works
- 14University of Science and Technology of ChinaUniversity · Hefei · #49 worldwide14.9% top 10% · 25k works
- 15Huazhong University of Science and TechnologyUniversity · Wuhan · #52 worldwide16.3% top 10% · 38k works

The track on each row is its top-10% rate; the tick is the average of all institutions, 10.0% (how it is set): teal above it, red below.
All ranked institutions in ChinaWho are the top researchers in China?
Guangmin Zhou, Shilong Piao and Jiaguo Yu rank highest among researchers based in China.
- 1 Guangmin Zhou #16 worldwide 61k citations · 443 works
- 2 Shilong Piao #28 worldwide 114k citations · 791 works
- 3 Jiaguo Yu #35 worldwide 207k citations · 1,086 works
- 4 Caijun Shi #42 worldwide 52k citations · 448 works
- 5 Zirui Jia #48 worldwide 21k citations · 181 works
- 6 Bei Cheng #56 worldwide 74k citations · 388 works
- 7 Daniel C.W. Tsang #58 worldwide 87k citations · 802 works
- 8 Xiangke Wang #60 worldwide 107k citations · 933 works
- 9 Bingan Lu #72 worldwide 42k citations · 391 works
- 10 Jian‐Kang Zhu #100 worldwide 164k citations · 752 works
Which cities in China are research hubs?
- 1
BeijingChina
2.7M works
- 2
ShanghaiChina
986k works
- 3
NanjingChina
720k works
- 4
WuhanChina
615k works
- 5
GuangzhouChina
608k works
- 6
Xi'anChina
594k works
- 7
HangzhouChina
449k works
- 8
ChengduChina
440k works
- 9
ChangshaChina
366k works
- 10
TianjinChina
360k works
- 11
HarbinChina
327k works
- 12
Hong KongChina
311k works
How much of it is in the largest
The same cities as shares of everything these twelve account for.
Shares of the rows listed above, not of the whole node.
How open and international is China's research?
30% of its research is openly available (world: 40%), and 12% is written with international co-authors (world: 18%).
World: 40% of research is openly available.
World: 18% is written across borders.
In 2022-now, 44% of its research is openly available (world 63%) and 15% is written with co-authors abroad (world 22%). Against what its own mix of topics predicts, that is 0.84× the expected open access and 0.63× the expected international share, which puts it #172 of 173 countries on openness.
How has China's research grown?
Output in 2022-2025 was 62% higher than in 2018-2021.
The same series as a ribbon: one cell per year, darker for more. The line above answers how much; this answers when.
Its share of all research
Growing output can still be a shrinking share: all of science grows. This is China as a percentage of every work published that year, 19% in 2024.
Fractional works of China over all fractional works that year. How the balance of science has shifted.
How much of it reaches the world top 10%
Over the whole record, 9.5% of its 14.5M works since 1950 reached the world top 10% for their field and year.
Of each year's output, the share that reached the world's 10% most cited for its field and year. Peak 13.6% in 2024.
Which countries have research most like China's?
North Korea is China's closest research twin: of all countries, its research is spread across the fields most like China's, with both strong in Chemical Engineering.
- 1
 North KoreaBoth strong in Chemical Engineering, Materials Science, Engineering
0.83 Compare
- 2
 TaiwanBoth strong in Materials Science, Chemical Engineering, Engineering
0.77 Compare
- 3
 South KoreaBoth strong in Materials Science, Chemical Engineering, Energy
0.76 Compare
- 4
 JapanBoth strong in Chemistry, Biochemistry, Genetics and Molecular Biology, Materials Science
0.63 Compare
- 5
 SingaporeBoth strong in Engineering, Chemical Engineering, Computer Science
0.56 Compare
Similarity is the correlation of each side's location quotients across every field it publishes in, on a log scale: 1 is the same shape of research, 0 is unrelated. It ignores size. How it is measured.
Compare China with
 United States
 Germany
 United Kingdom
 France
Share China's ranking



Research fields in China
- Physical Sciences
- Engineering
- Agricultural and Biological Sciences
- Environmental Science
- Plant Science
- Materials Science
- Electrical and Electronic Engineering
- Social Sciences
- Health Sciences
- Biomedical Engineering
- Strategy and Management
- Medicine
- Social Sciences
- Mechanical Engineering
- Life Sciences
- Food Science
- Materials Chemistry
- Civil and Structural Engineering
- Chemistry
- Energy
- Building and Construction
- Computer Networks and Communications
- Ecology
- Control and Systems Engineering
- Renewable Energy, Sustainability and the Environment
- Computer Vision and Pattern Recognition
- Nursing
- Aerospace Engineering
- Management, Monitoring, Policy and Law
- Computer Science
- Environmental Engineering
- Organic Chemistry
- Mechanics of Materials
- Dentistry
- Nutrition and Dietetics
- Industrial and Manufacturing Engineering
- Water Science and Technology
- Pollution
- Education
- Automotive Engineering
- Health, Toxicology and Mutagenesis
- Business, Management and Accounting
- Ocean Engineering
- Economics, Econometrics and Finance
- Psychology
- Health Professions
- Marketing
- Biochemistry, Genetics and Molecular Biology
- Computational Mechanics
- Insect Science
- Biomaterials
- Transportation
- Economics and Econometrics
- Industrial and Manufacturing Engineering
- Atmospheric Science
- Signal Processing
- Polymers and Plastics
- Animal Science and Zoology
- Media Technology
- Geophysics
Questions people ask
Which cities in China have the most research institutes?
By research output, Beijing, Shanghai, Nanjing and Wuhan.
Also asked as
- Which cities in China are research hubs?
Is China's research output still growing?
Output in 2022-2025 was 62% higher than in 2018-2021.
Also asked as
- How fast is research in China growing?
What is China strongest at in science?
On research quality in 2022-now, China ranks highest in Engineering (#1 of 131), Agricultural and Biological Sciences (#1 of 124) and Environmental Science (#1 of 122). Relative to its size it is most specialised in General Engineering, Acoustics and Ultrasonics and Catalysis.
Also asked as
- What is Hong Kong strongest at in science?
How open and international is research in China?
30% of its research is openly available (world: 40%), and 12% is written with international co-authors (world: 18%).
How open and international is China's research?Who are the top scientists in China?
Guangmin Zhou, Shilong Piao and Jiaguo Yu rank highest among researchers based in China.
Who are the top researchers in China?Discussion
Ask a question or share a note about China. Posts are plain text and can be reported.